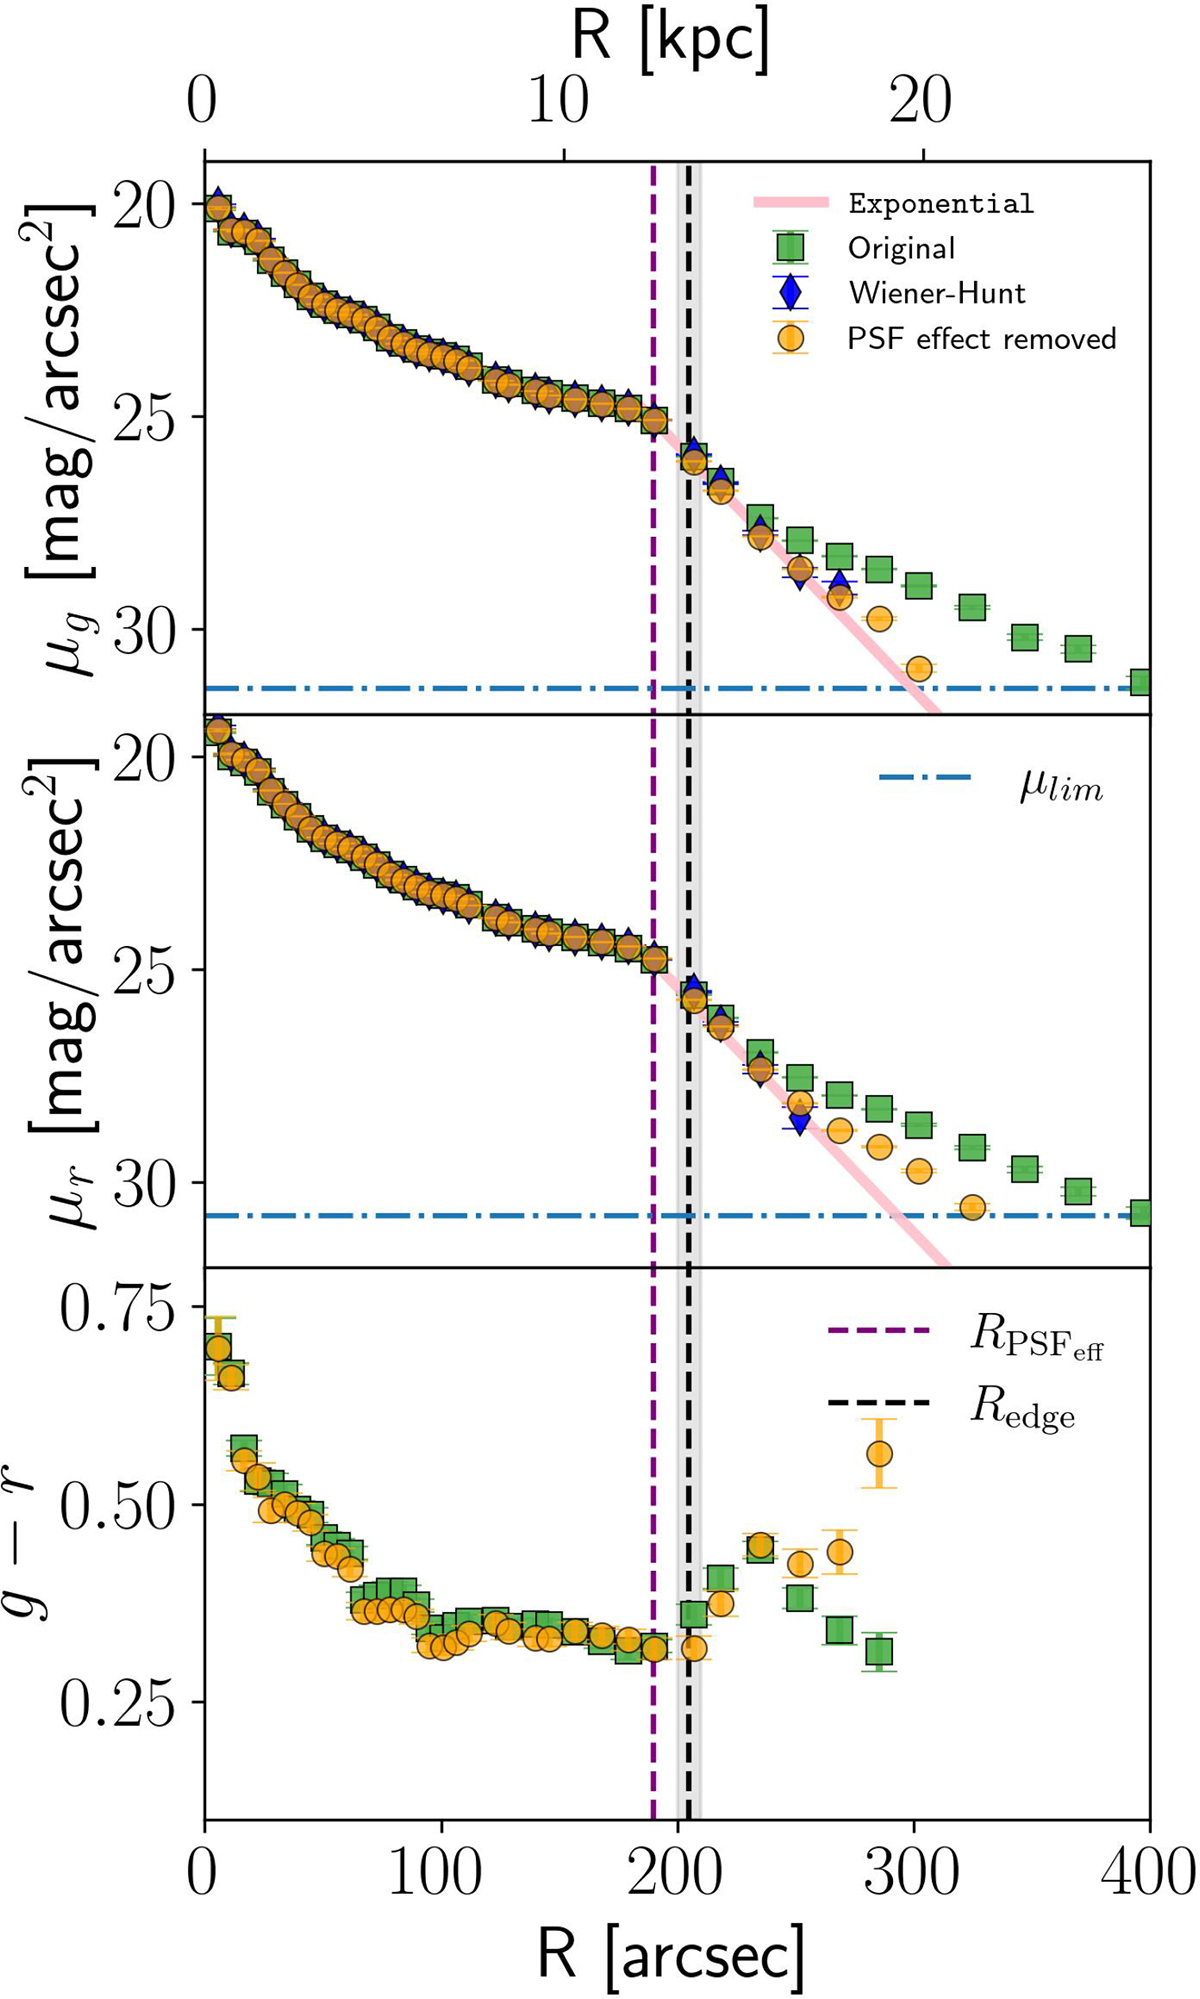
Fig. 4.
Download original image
Surface brightness profiles of NGC 3486 in the g band (upper panel) and r band (central panel) using LIGHTS data. The surface brightness profiles shown correspond to the background-subtracted data (green), the Wiener-Hunt deconvolved data (blue), and the data for which the PSF effect has been removed (orange). These profiles were obtained using a fixed ellipticity and PA representative of the outer parts of the galaxy (see the main text for details). Only values above 3σ the noise of the data are shown. The pink lines correspond to the IMFIT models we used to model the Wiener-Hunt deconvolved light distribution of the galaxy. The vertical dashed black lines highlight the location of Redge with the corresponding shaded gray uncertainty, dashed vertical purple lines highlight the location of RPSFeff (the radius where the PSF starts to be noticeable), and horizontal blue lines represent the data surface brightness limiting depth. The g − r average radial profiles prior and after deconvolution are shown in the bottom panel.
Current usage metrics show cumulative count of Article Views (full-text article views including HTML views, PDF and ePub downloads, according to the available data) and Abstracts Views on Vision4Press platform.
Data correspond to usage on the plateform after 2015. The current usage metrics is available 48-96 hours after online publication and is updated daily on week days.
Initial download of the metrics may take a while.