Fig. 5.
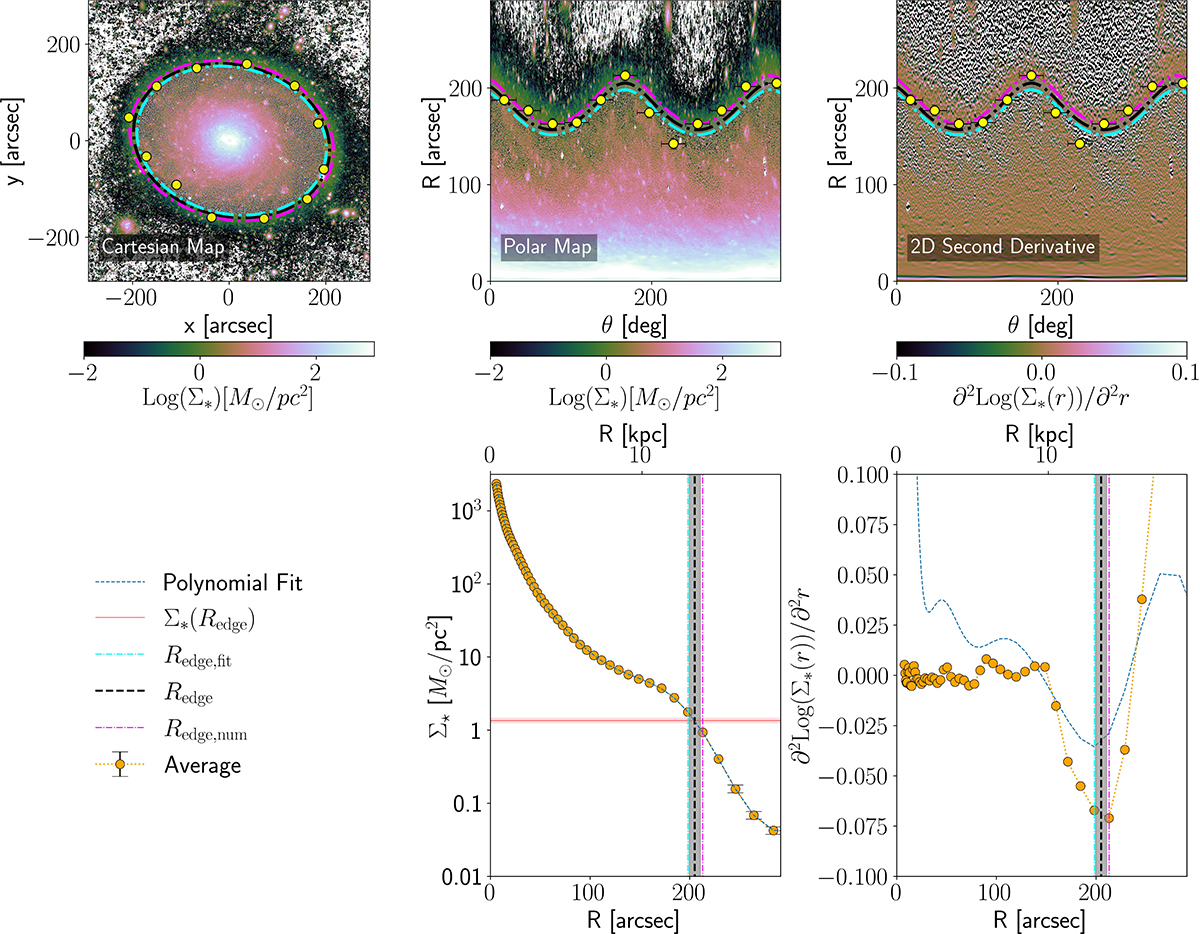
Download original image
Edge detection in NGC 3486. Upper row: stellar mass surface density map in Cartesian and polar coordinates (left and central panels) and polar map of its second derivative (right). Bottom row: radial profile of averaged stellar mass surface density as a function of radius (central panel) along with its second derivative (right panel). A polynomial fit to the data and its second derivative are also shown (blue). In all panels shaded regions indicate measurement uncertainties. The outer boundary, Redge is indicated in all panels by a dashed black line. Σ*(Redge) is shown as a horizontal red line in the bottom central panel. Yellow dots in the upper panels mark Redge, θ.
Current usage metrics show cumulative count of Article Views (full-text article views including HTML views, PDF and ePub downloads, according to the available data) and Abstracts Views on Vision4Press platform.
Data correspond to usage on the plateform after 2015. The current usage metrics is available 48-96 hours after online publication and is updated daily on week days.
Initial download of the metrics may take a while.