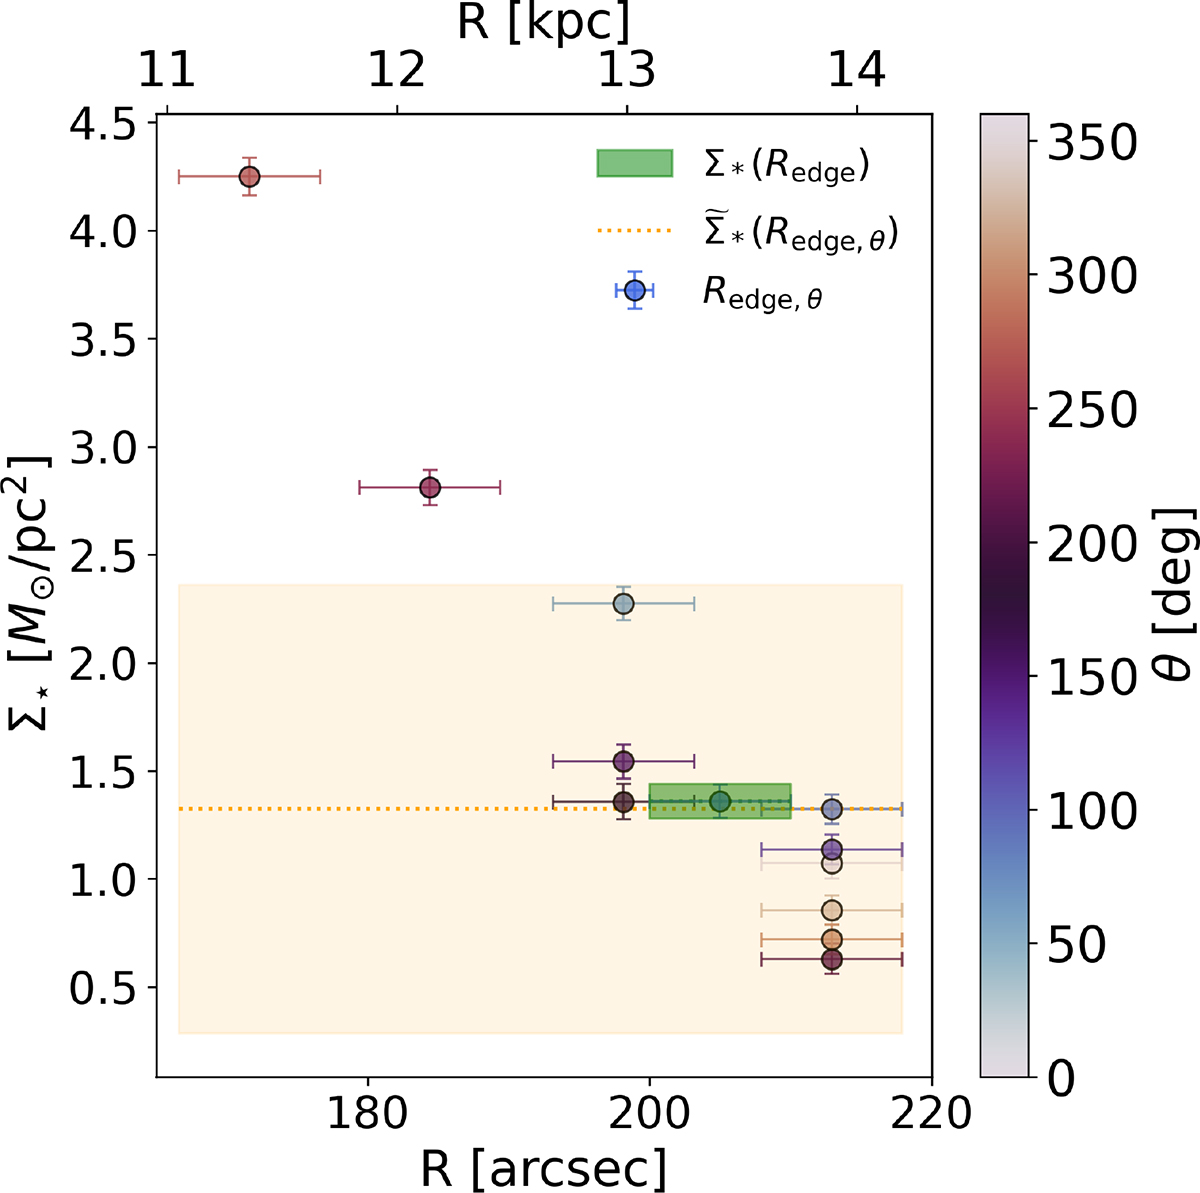
Fig. 6.
Download original image
Distribution of stellar surface mass density at Redge, θ. The green box corresponds to 1.3 ± 0.1 M⊙/pc2 at Redge. The orange line corresponds to the median of the Σ⋆(Redge, θ). The colored region corresponds to a 1σ dispersion. Coincidence of locations at Redge, θ occurs because of the limited resolution of the method. Points are color-coded by θ.
Current usage metrics show cumulative count of Article Views (full-text article views including HTML views, PDF and ePub downloads, according to the available data) and Abstracts Views on Vision4Press platform.
Data correspond to usage on the plateform after 2015. The current usage metrics is available 48-96 hours after online publication and is updated daily on week days.
Initial download of the metrics may take a while.