Fig. 1.
Download original image
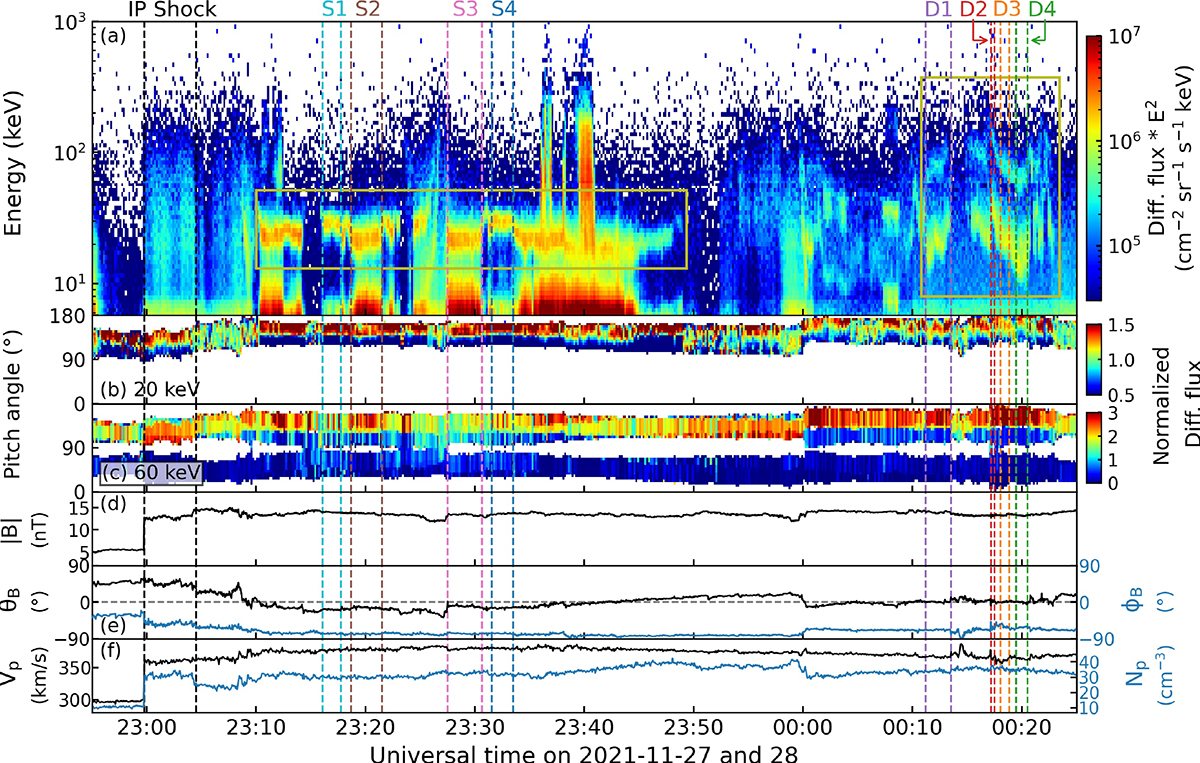
Overview plot of AMIs observed downstream of the IP shock on 27 November, 2021. (a) Spectrogram of dynamic energy spectra measured by EPT’s sunward telescope and STEP’s central 9 pixels. The yellow rectangles highlight the AMIs analyzed in this study. (b)–(c) PADs in the solar wind frame reconstructed from STEP (b) and EPT (c) measurements. The measured ions are assumed to be predominately protons. The color scale indicates the differential flux normalized by the flux averaged over all available PAs for each time bin. Beamed distributions exhibit higher values (red) in the beaming direction and lower values (blue) in other directions. (d) Magnitude |B| of the IMF. (e) Elevation angle, θB (black), and azimuthal angle, ϕB (blue), of the IMF in GSE coordinates. (f) Solar wind proton bulk speed, Vp (black), and proton number density, Np (blue). Vertical dashed lines bound several time intervals, labeled at the top as “S” for single-peak AMIs, “D” for double-peak AMIs, and “IP Shock” for the ∼5-minute interval immediately after the shock.
Current usage metrics show cumulative count of Article Views (full-text article views including HTML views, PDF and ePub downloads, according to the available data) and Abstracts Views on Vision4Press platform.
Data correspond to usage on the plateform after 2015. The current usage metrics is available 48-96 hours after online publication and is updated daily on week days.
Initial download of the metrics may take a while.