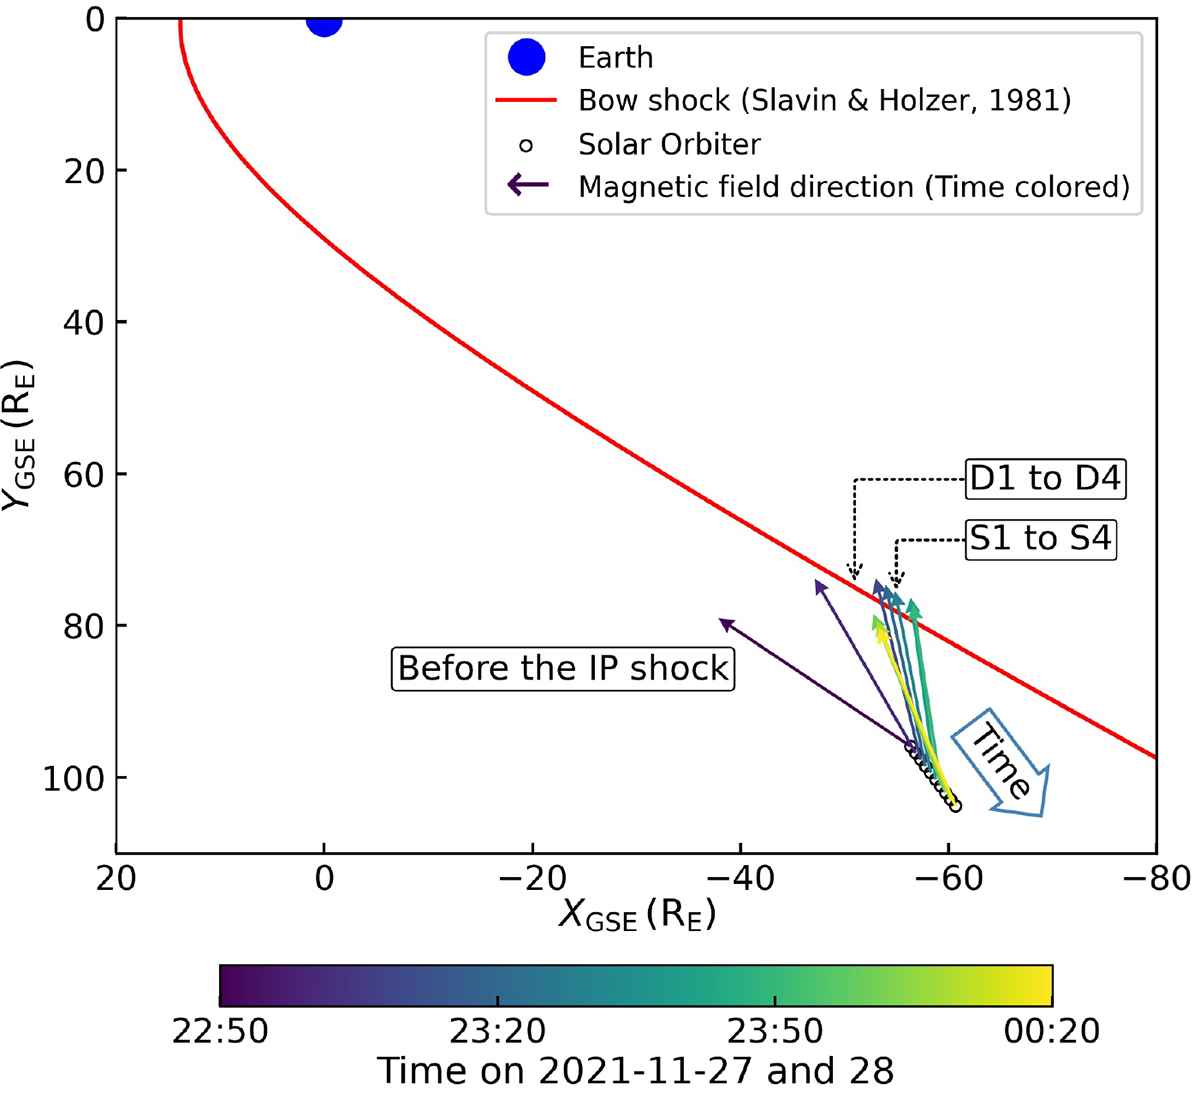
Fig. 2.
Download original image
Solar Orbiter positions projected on the X–Y plane in GSE coordinates, sampled at 10-minute intervals. The arrows, color-coded by time, indicate the IMF direction. The red curve represents the bow shock, calculated using the Slavin and Holzer model (Slavin & Holzer 1981) with a solar wind speed of 380 km/s. The dashed arrows indicate the estimated source regions on the bow shock for the single- and double-peak AMIs, based on a linear extrapolation of the IMF.
Current usage metrics show cumulative count of Article Views (full-text article views including HTML views, PDF and ePub downloads, according to the available data) and Abstracts Views on Vision4Press platform.
Data correspond to usage on the plateform after 2015. The current usage metrics is available 48-96 hours after online publication and is updated daily on week days.
Initial download of the metrics may take a while.