Open Access
Fig. A.1.
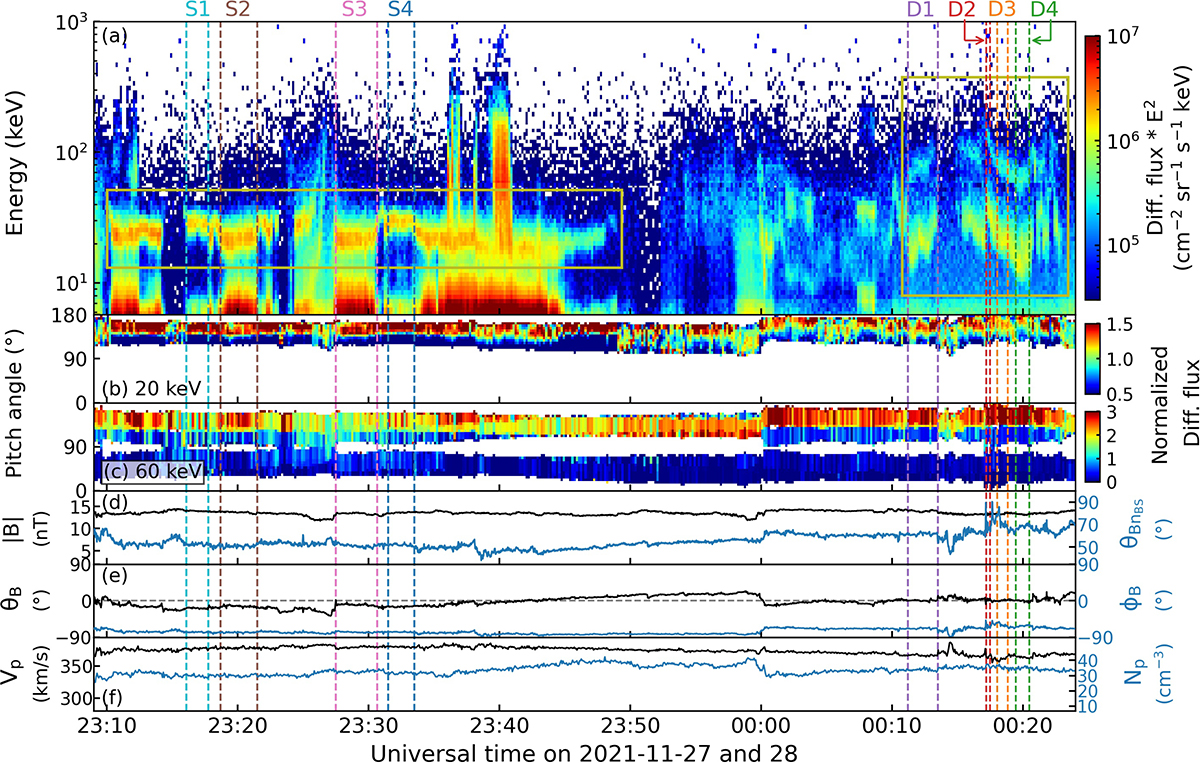
Download original image
Zoomed-in plot around the AMI periods, presented in a similar format to Fig. 1. In panel (d), the blue curve shows the angle between the IMF and the bow shock normal at their linearly extrapolated intersection point, denoted as θBnBS.
Current usage metrics show cumulative count of Article Views (full-text article views including HTML views, PDF and ePub downloads, according to the available data) and Abstracts Views on Vision4Press platform.
Data correspond to usage on the plateform after 2015. The current usage metrics is available 48-96 hours after online publication and is updated daily on week days.
Initial download of the metrics may take a while.