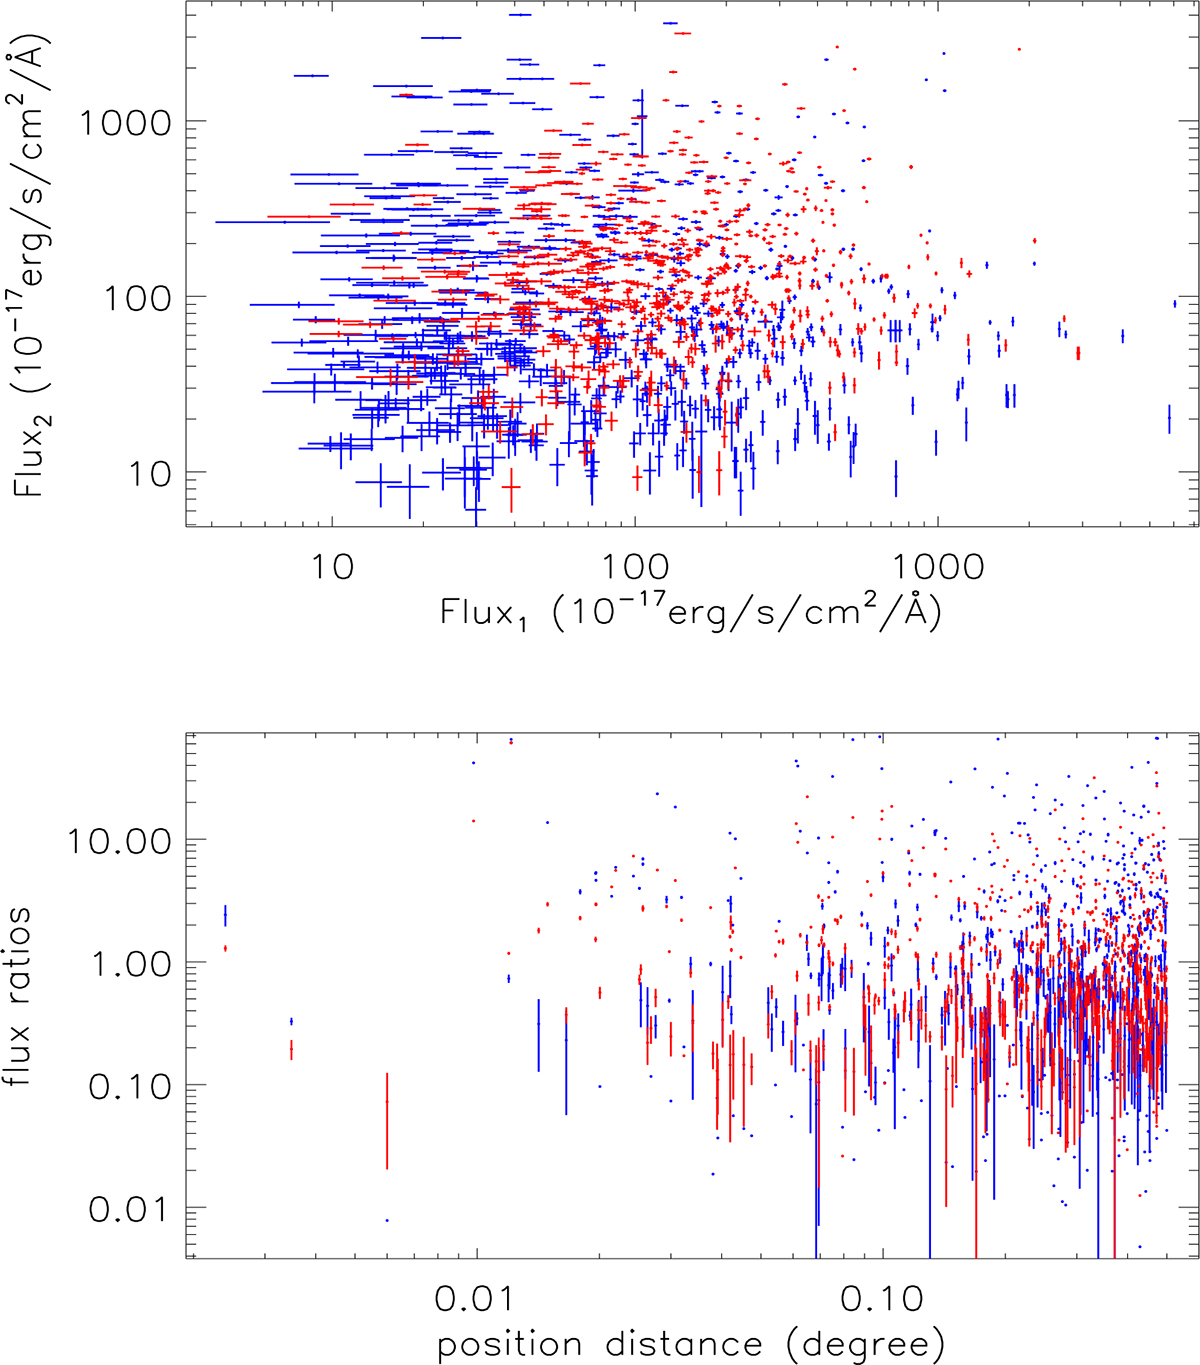
Fig. 2.
Download original image
Top panel: Flux correlations of narrow emission lines of both [O III]λ5007 Å (in blue) and narrow Hα (in red) in the 669 AGN pairs with a redshift difference smaller than 0.001 and with a position distance smaller than 30 arcmin. Bottom panel: Dependences of narrow emission line flux ratios on position distance. In the bottom panel, the symbols in blue and red show the flux ratios respectively of [O III]λ5007 Å and of narrow Hα in the 669 AGN pairs.
Current usage metrics show cumulative count of Article Views (full-text article views including HTML views, PDF and ePub downloads, according to the available data) and Abstracts Views on Vision4Press platform.
Data correspond to usage on the plateform after 2015. The current usage metrics is available 48-96 hours after online publication and is updated daily on week days.
Initial download of the metrics may take a while.