Open Access
Fig. A.1
Download original image
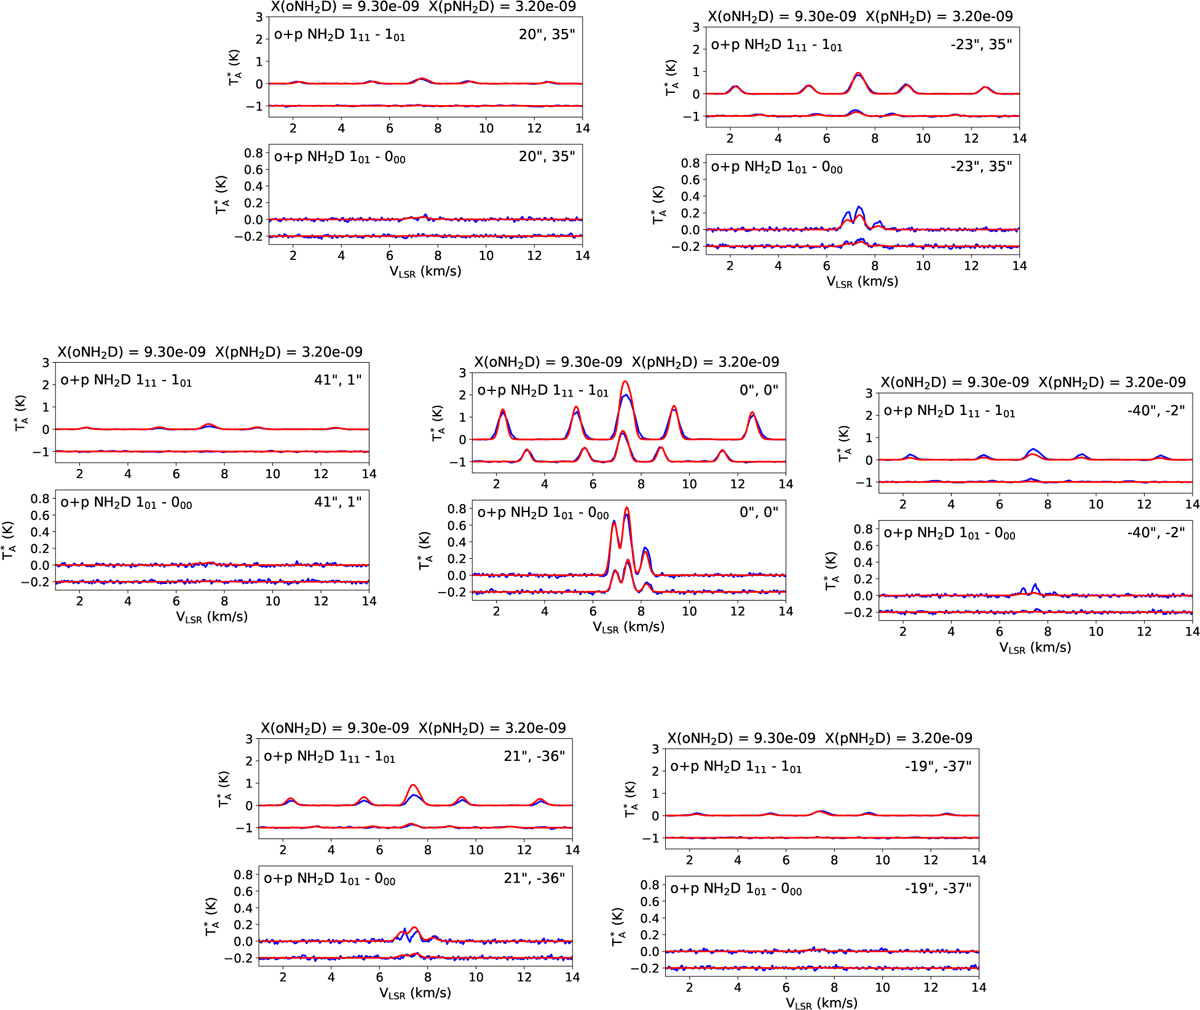
NH2D spectra observed with the APEX and IRAM 30 m telescopes (blue lines). The positions correspond to the seven pixels of the LAsMA array. Upper panels: 111 − 101 spectra from IRAM 30 m. Lower panels: 101 − 000 from APEX. Simulated spectra from the model discussed in Sect. 6 are shown in red.
Current usage metrics show cumulative count of Article Views (full-text article views including HTML views, PDF and ePub downloads, according to the available data) and Abstracts Views on Vision4Press platform.
Data correspond to usage on the plateform after 2015. The current usage metrics is available 48-96 hours after online publication and is updated daily on week days.
Initial download of the metrics may take a while.