Fig. B.1
Download original image
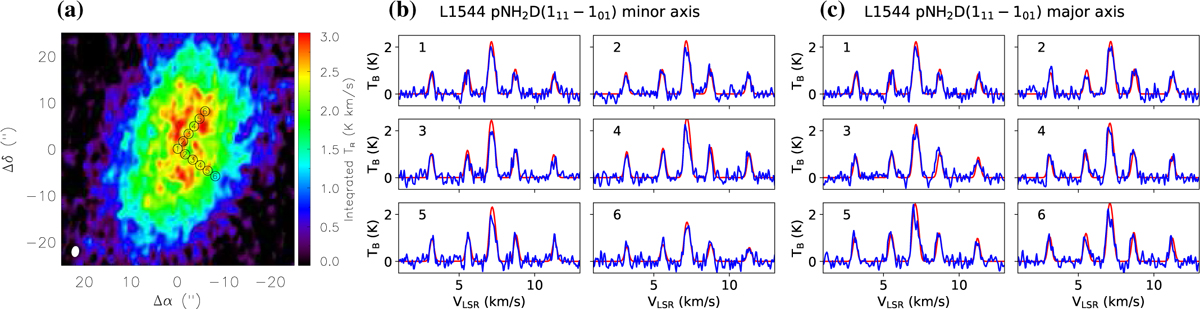
111 − 101 spectra of pNH2D observed with ALMA along two orthogonal strips across L1544. The data are from Caselli et al. (2022). (a): Integrated line intensity map. The positions where the spectra are extracted are indicated with numbered circles. The synthesised beam is shown in the bottom left. (b): Six spectra along the minor axis of the core (from the centre to the south-west). The number in the top left of each panel refers to the circled numbers on the map. The positions are separated by 2″. (c): Same as panel (b) but along the major axis of the core (from the centre to the north-west). The spectra predicted from the model described in Sect. 6 are shown in red. Unlike the integrated intensity map of panel (a), the observed spectra in panels (b) and (c) have been corrected for the primary beam response.
Current usage metrics show cumulative count of Article Views (full-text article views including HTML views, PDF and ePub downloads, according to the available data) and Abstracts Views on Vision4Press platform.
Data correspond to usage on the plateform after 2015. The current usage metrics is available 48-96 hours after online publication and is updated daily on week days.
Initial download of the metrics may take a while.