Fig. 5
Download original image
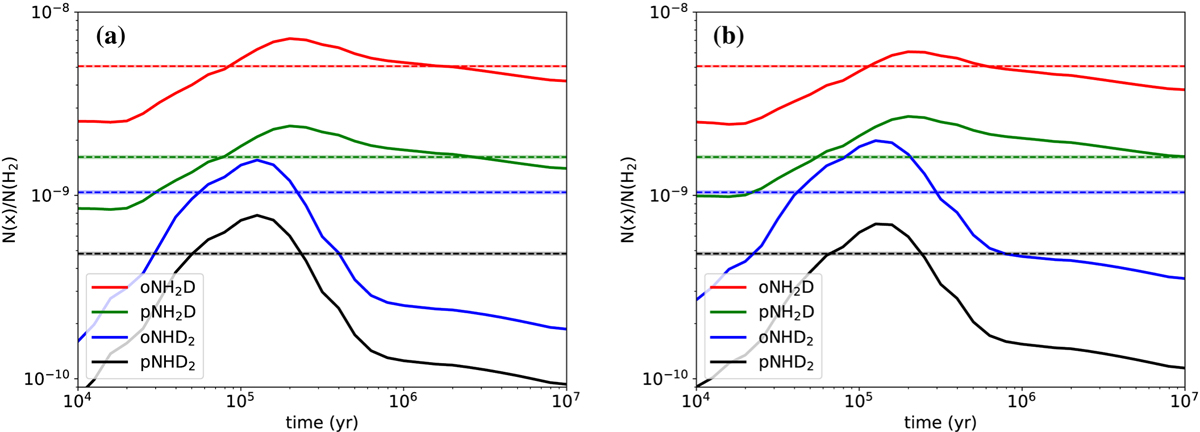
Evolution of the fractional abundances of oNH2D, pNH2D, oNHD2, and pNHD2 in the core model. The abundances correspond to the column density ratios N(mol)/N(H2) towards the centre of the core, smoothed to the resolution of the ![]() APEX beam at 333 GHz. Predictions from the PH scenario in the chemical network (a) and the FS scenario (b). In this simulation, a = 0.2 μm and ζH2 = 2.6 × 10⁻¹⁷ s−1. The horizontal dashed lines and thick semi-transparent lines represent the fractional abundances and their formal 1σ errors derived towards (0,0) in Sect. 3. These abundances are listed in Table 3.
APEX beam at 333 GHz. Predictions from the PH scenario in the chemical network (a) and the FS scenario (b). In this simulation, a = 0.2 μm and ζH2 = 2.6 × 10⁻¹⁷ s−1. The horizontal dashed lines and thick semi-transparent lines represent the fractional abundances and their formal 1σ errors derived towards (0,0) in Sect. 3. These abundances are listed in Table 3.
Current usage metrics show cumulative count of Article Views (full-text article views including HTML views, PDF and ePub downloads, according to the available data) and Abstracts Views on Vision4Press platform.
Data correspond to usage on the plateform after 2015. The current usage metrics is available 48-96 hours after online publication and is updated daily on week days.
Initial download of the metrics may take a while.