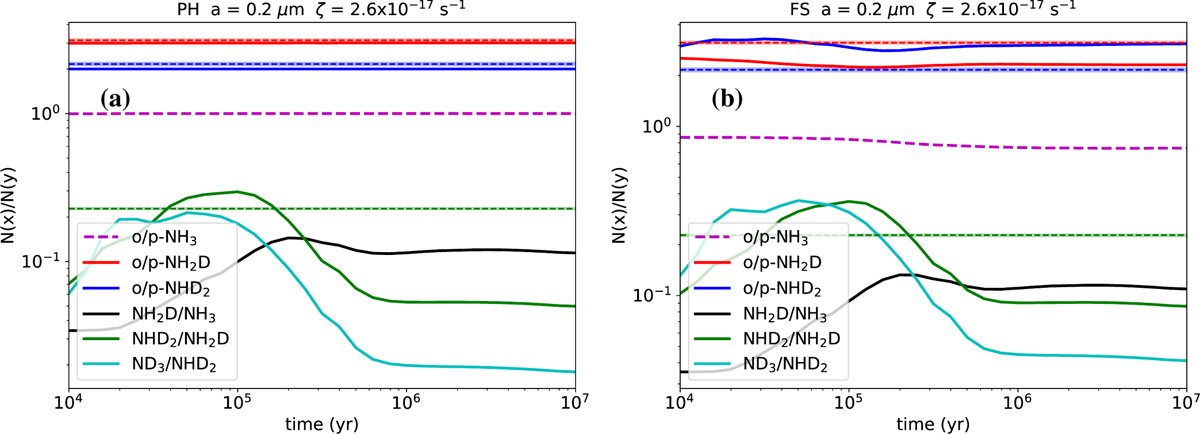
Fig. 6
Download original image
Evolution of the o/p-NH3, o/p-NH2D, and o/p-NHD2 ratios and the fractionation ratios NH2D/NH3, NHD2/NH2D, and ND3/NHD2 according to the PH (a) and FS (b) models visualised in Fig. 5. The fractional abundances used for the ratios are calculated in the same way as those shown in Fig. 5. The horizontal straight dashed lines and semi-transparent thick lines represent the abundance ratios derived towards (0,0) from APEX observations (Sect. 3). Observational data for NH3 and ND3 are not available at the same resolution.
Current usage metrics show cumulative count of Article Views (full-text article views including HTML views, PDF and ePub downloads, according to the available data) and Abstracts Views on Vision4Press platform.
Data correspond to usage on the plateform after 2015. The current usage metrics is available 48-96 hours after online publication and is updated daily on week days.
Initial download of the metrics may take a while.