Fig. 7
Download original image
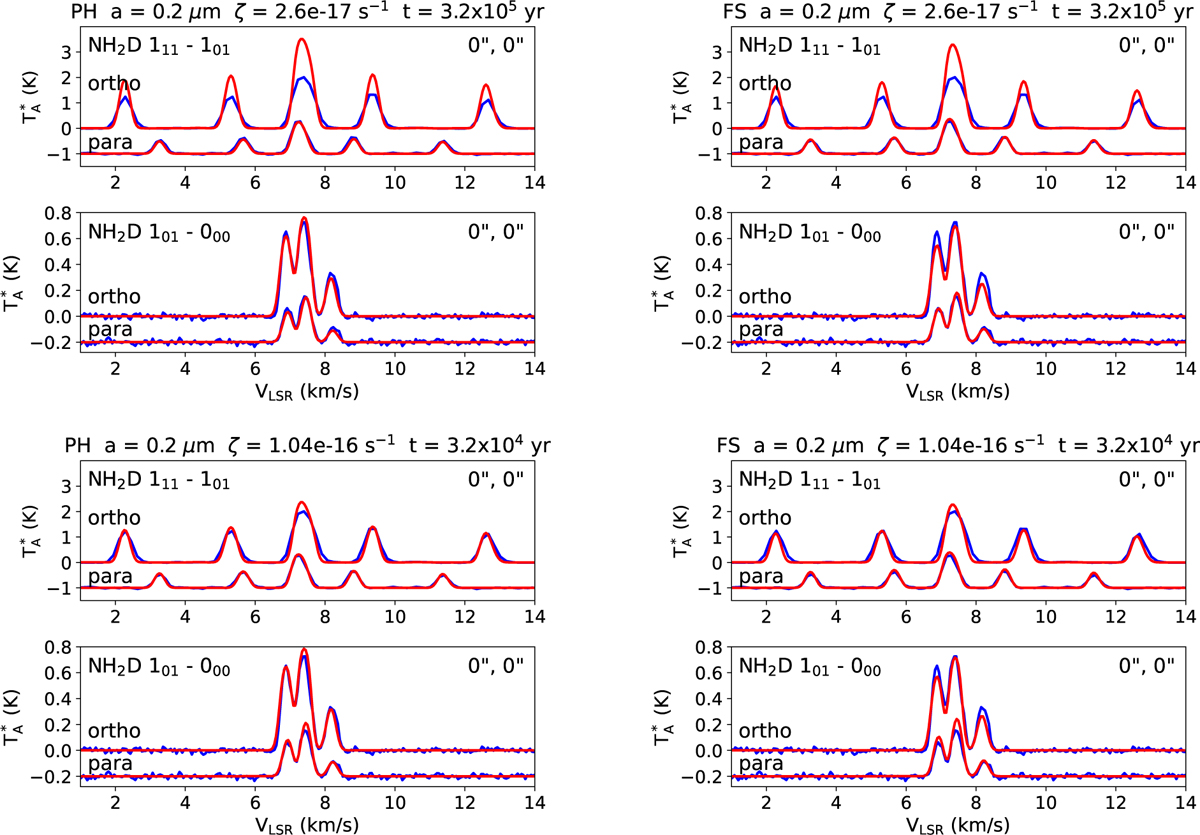
Observed (blue) and simulated (red) NH2D spectra towards (0,0). Left: simulations from the PH model with two different sets of model parameters. Right: results from the FS model with the same parameter values. The model parameters are given at the top of each panel. The upper plot in each of the four panels shows the 111 − 101 lines and the lower plot shows the 101 − 000 lines of oNH2D and pNH2D. The para-lines are shifted downwards for clarity.
Current usage metrics show cumulative count of Article Views (full-text article views including HTML views, PDF and ePub downloads, according to the available data) and Abstracts Views on Vision4Press platform.
Data correspond to usage on the plateform after 2015. The current usage metrics is available 48-96 hours after online publication and is updated daily on week days.
Initial download of the metrics may take a while.