Open Access
Fig. 3.
Download original image
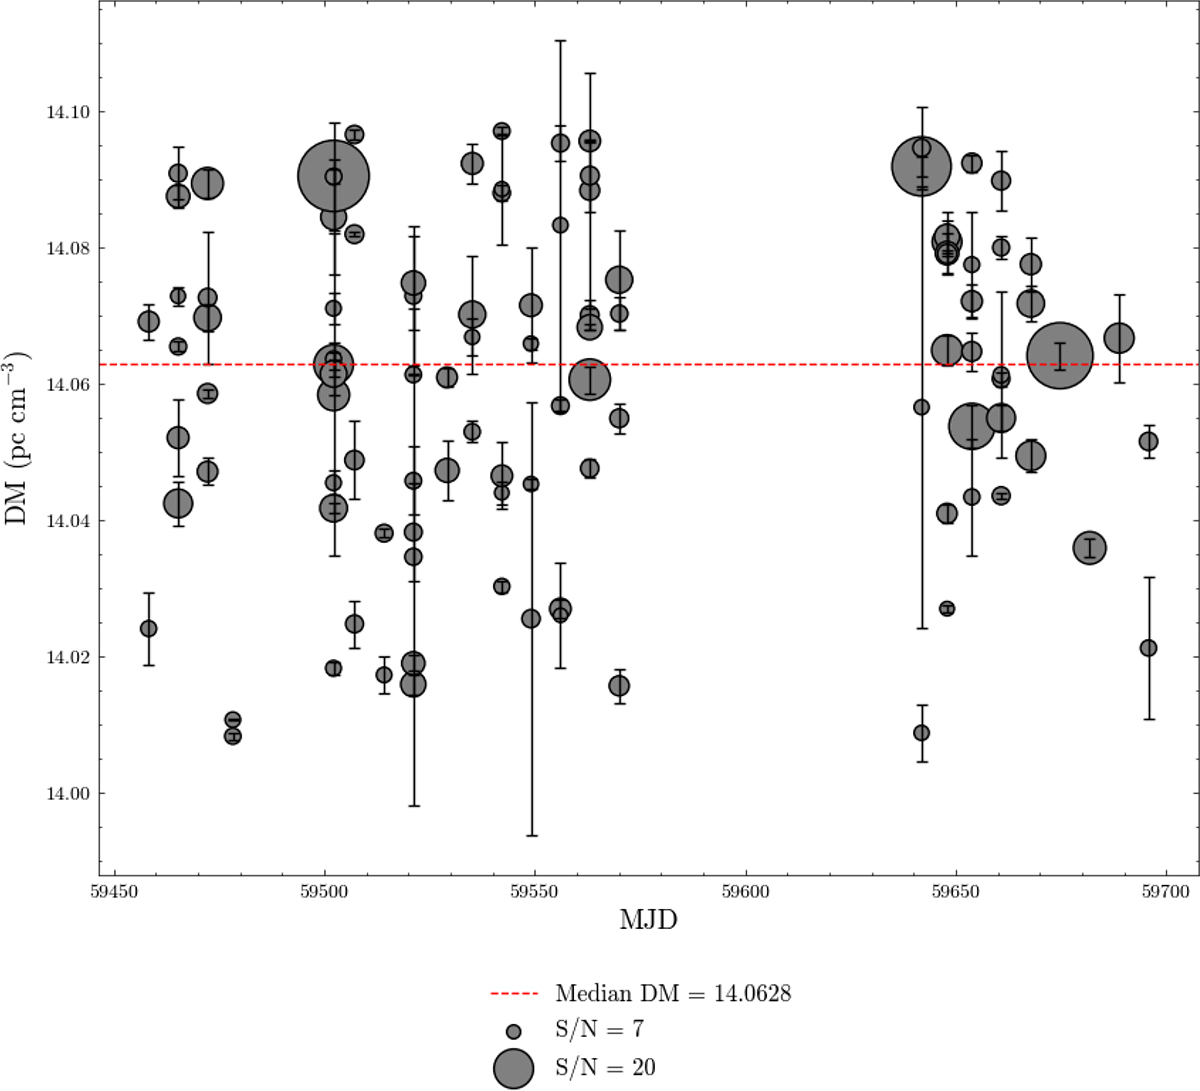
DM of the single pulses obtained using DM_PHASE algorithm. The circle sizes are representative of the S/N of the pulse, as is shown in the legend. The red line is the median DM of all the single pulses.
Current usage metrics show cumulative count of Article Views (full-text article views including HTML views, PDF and ePub downloads, according to the available data) and Abstracts Views on Vision4Press platform.
Data correspond to usage on the plateform after 2015. The current usage metrics is available 48-96 hours after online publication and is updated daily on week days.
Initial download of the metrics may take a while.