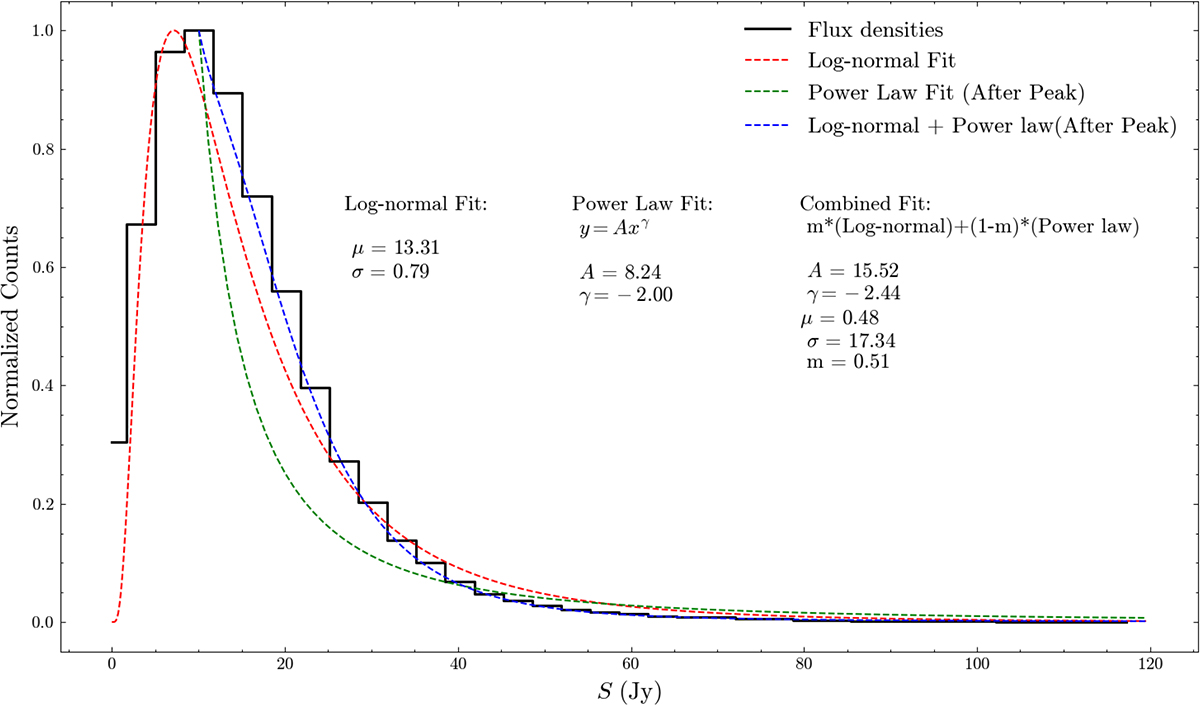
Fig. 4.
Download original image
Noise-incorporated flux density distribution of all the 103 pulses. The black line is the normalised histogram of the flux densities. We attempted to fit various models to this histogram. The dashed red line is the log-normal distribution, the dashed green line is the power-law distribution, and the dashed blue line is the combined model of log-normal+ power law. The best fit model turned out to be a combination of a 51% log-normal and 49% power law distribution.
Current usage metrics show cumulative count of Article Views (full-text article views including HTML views, PDF and ePub downloads, according to the available data) and Abstracts Views on Vision4Press platform.
Data correspond to usage on the plateform after 2015. The current usage metrics is available 48-96 hours after online publication and is updated daily on week days.
Initial download of the metrics may take a while.