Fig. 5.
Download original image
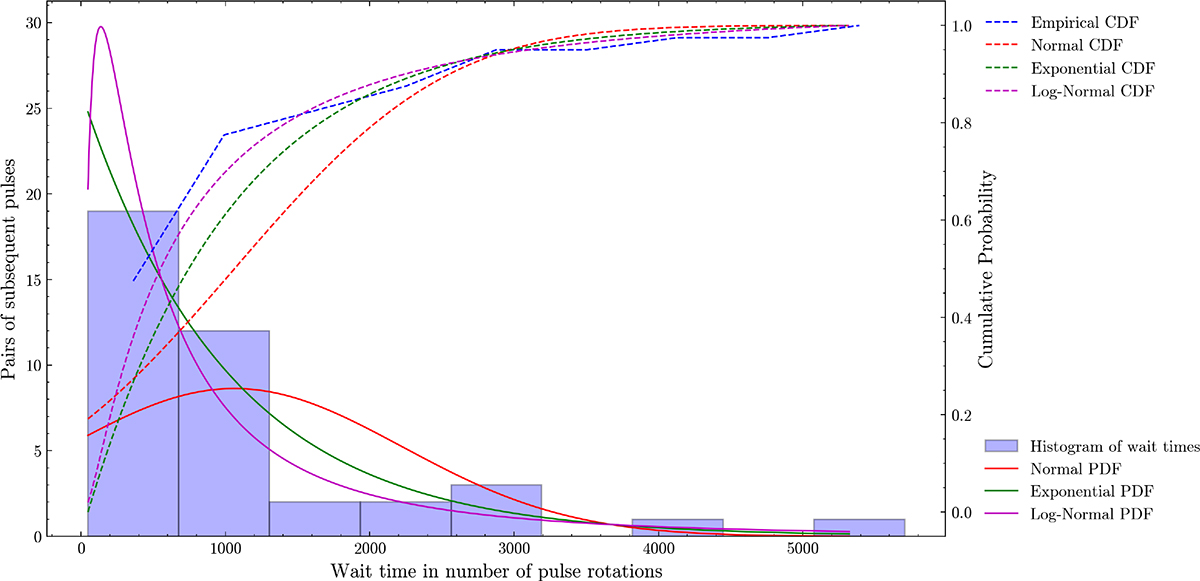
Wait time distribution of the single pulses observed on MJD 60747. The abscissa is the wait time between subsequent pulses expressed in terms of the number of pulse periods. The ordinate is the number of pairs of subsequent pulses. The blue histogram is the distribution of the wait times. The solid lines represent the PDFs of various models and the dotted lines represent the CDFs. The dotted blue line is the empirical CDF. It closely aligns with the exponential distribution, implying a likely Poisson process.
Current usage metrics show cumulative count of Article Views (full-text article views including HTML views, PDF and ePub downloads, according to the available data) and Abstracts Views on Vision4Press platform.
Data correspond to usage on the plateform after 2015. The current usage metrics is available 48-96 hours after online publication and is updated daily on week days.
Initial download of the metrics may take a while.