Fig. 6.
Download original image
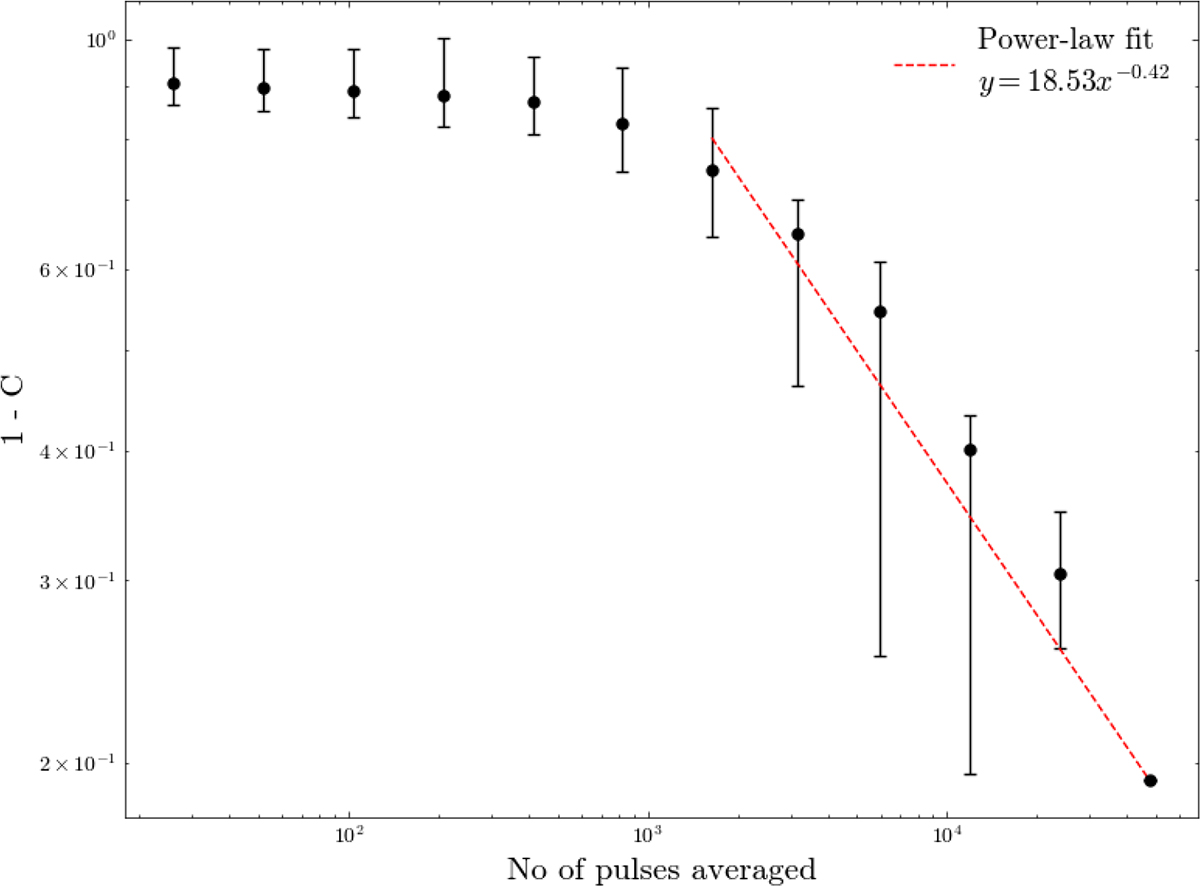
Cross-correlation factor plotted as (1–C) on the y axis, where C represents the correlation between the template profile and sub-integrated averaged profiles. The x axis shows the number of pulse rotations on a logarithmic scale. A lower (1–C) value indicates a higher similarity with the template. The red line denotes the best-fit power-law trend. The exponent for the power law fit is −0.42 ± 0.03.
Current usage metrics show cumulative count of Article Views (full-text article views including HTML views, PDF and ePub downloads, according to the available data) and Abstracts Views on Vision4Press platform.
Data correspond to usage on the plateform after 2015. The current usage metrics is available 48-96 hours after online publication and is updated daily on week days.
Initial download of the metrics may take a while.