Open Access
Fig. 5.
Download original image
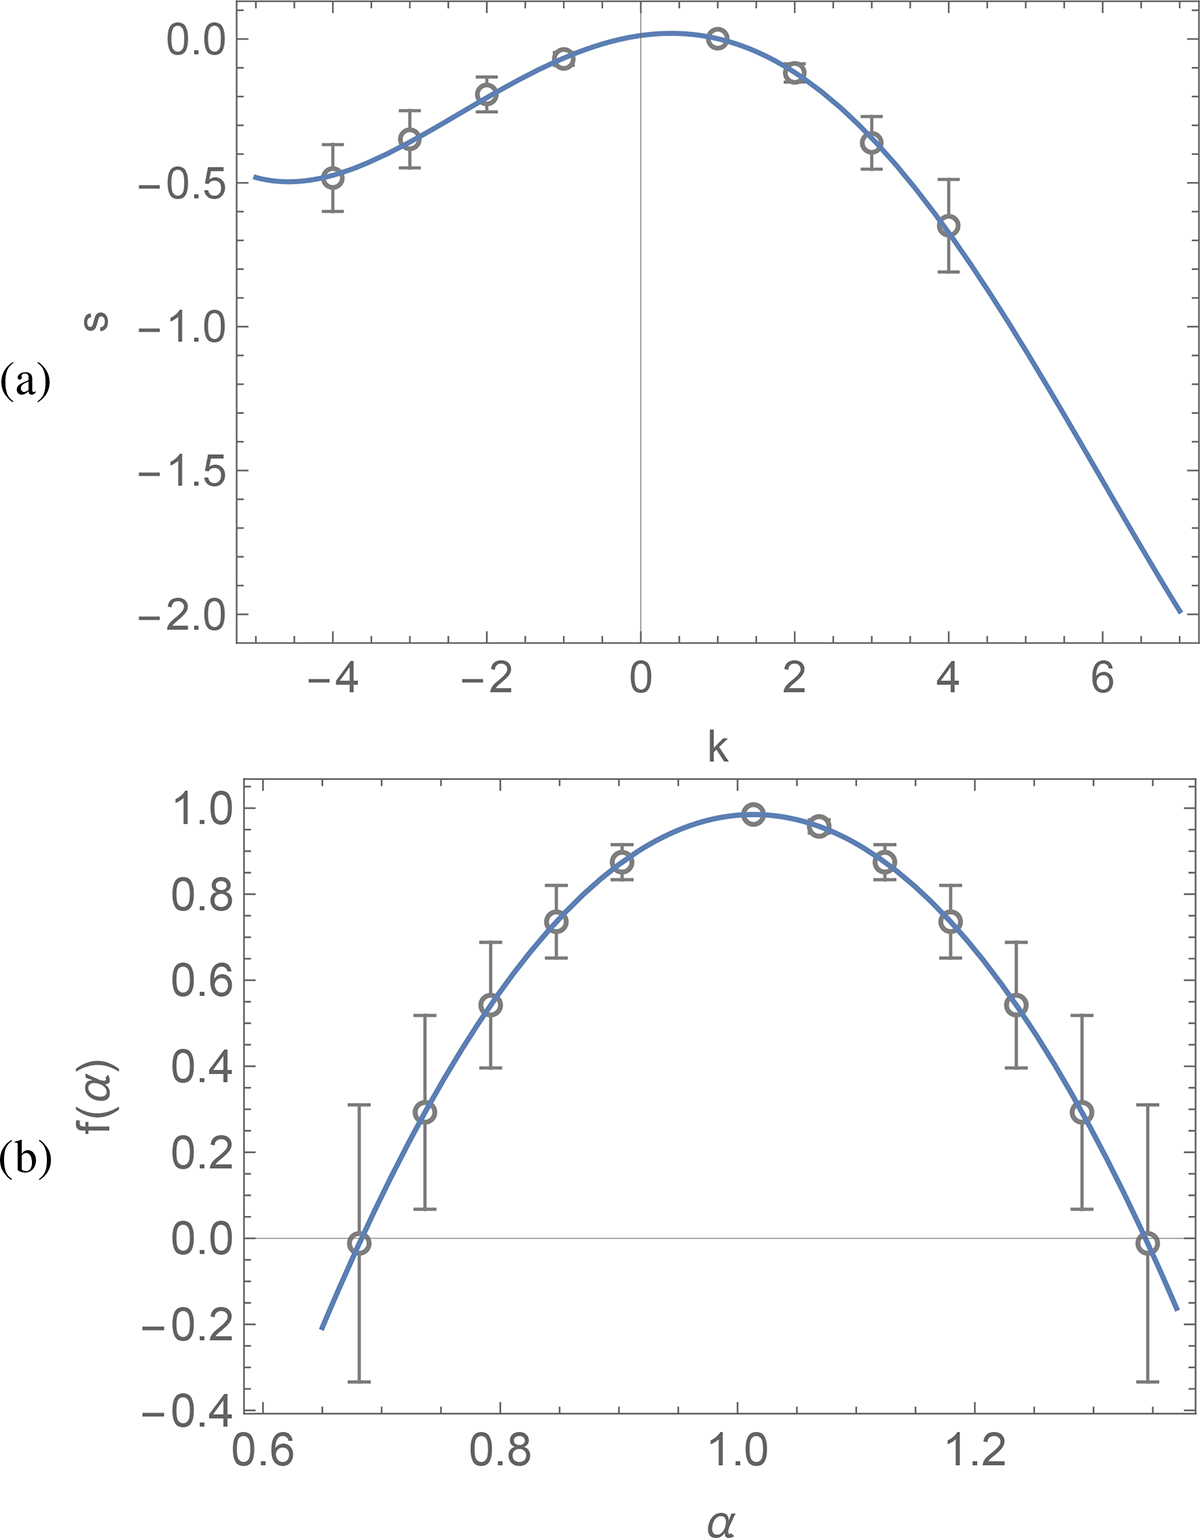
(a) Points (ki, si) with error bars, derived from the slopes in Fig. 4. The solid curve is a fourth-degree polynomial fit. (b) Multifractal spectrum f(α) derived from the same data. The solid curve is a quadratic polynomial fit used to determine the zeros αmax and αmin.
Current usage metrics show cumulative count of Article Views (full-text article views including HTML views, PDF and ePub downloads, according to the available data) and Abstracts Views on Vision4Press platform.
Data correspond to usage on the plateform after 2015. The current usage metrics is available 48-96 hours after online publication and is updated daily on week days.
Initial download of the metrics may take a while.