Fig. 3
Download original image
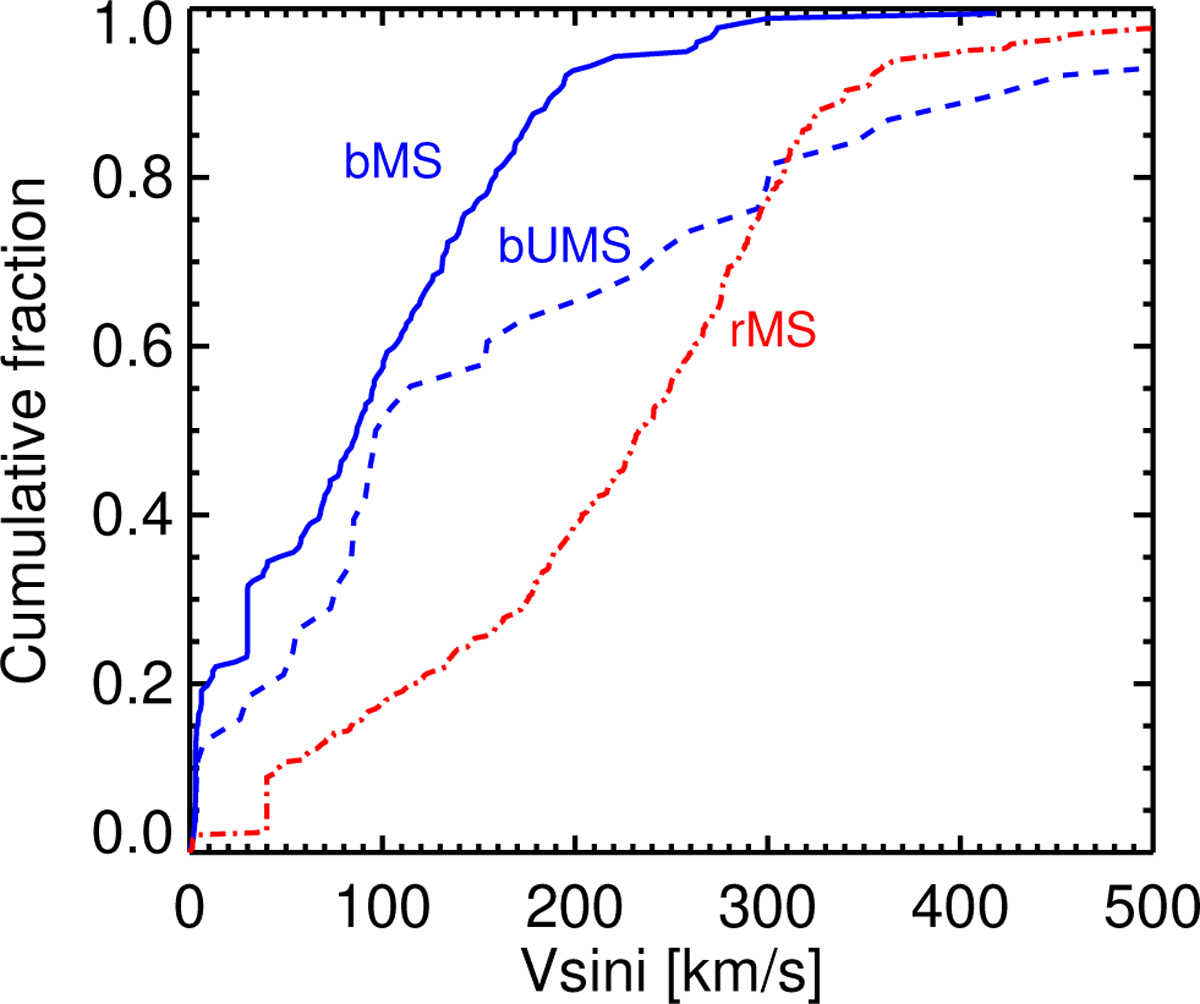
Cumulative V sin i distribution of the combined bMS (solid blue line) and bUMS (dashed blue line) from all clusters. A KS test reveals that the two populations differ significantly (p=0.014). We also show the V sin i distribution of the rMS (dot-dashed red line) of the three clusters combined, selected from stars with similar magnitudes as the bMS.
Current usage metrics show cumulative count of Article Views (full-text article views including HTML views, PDF and ePub downloads, according to the available data) and Abstracts Views on Vision4Press platform.
Data correspond to usage on the plateform after 2015. The current usage metrics is available 48-96 hours after online publication and is updated daily on week days.
Initial download of the metrics may take a while.