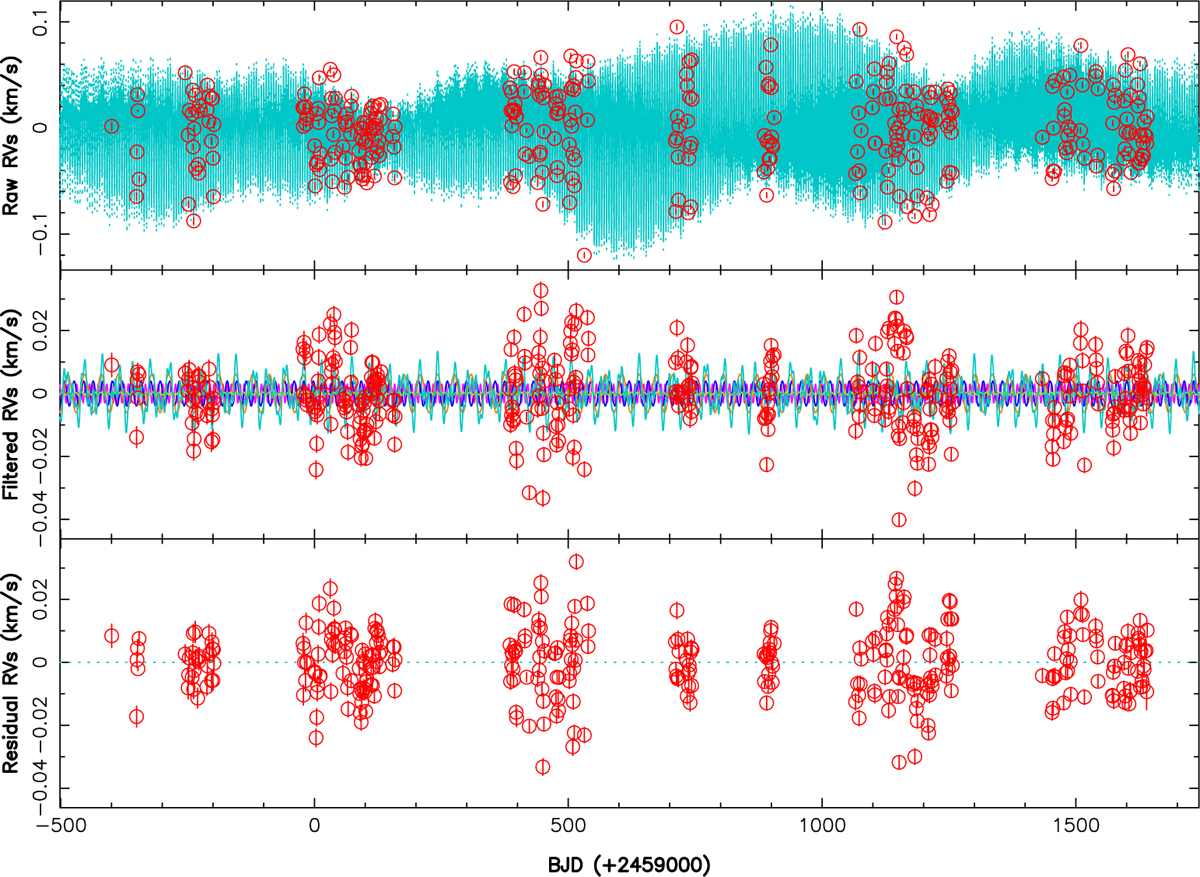
Fig. 4
Download original image
Raw (top), filtered (middle), and residual (bottom) RVs of AU Mic (red dots) over the observing period. The top panel shows the MCMC fit to the data, including a QP GPR modeling of the activity and the RV signatures of all four planets (cyan). The middle panel shows the planet RV signatures (pink, blue, green, orange, and cyan for planets b, c, d, e, and b+c+d+e, respectively) once activity is filtered out. The rms of the residuals is 10.1 m s−1. A zoom on the 2023 and 2024 data is shown in Fig. D.1.
Current usage metrics show cumulative count of Article Views (full-text article views including HTML views, PDF and ePub downloads, according to the available data) and Abstracts Views on Vision4Press platform.
Data correspond to usage on the plateform after 2015. The current usage metrics is available 48-96 hours after online publication and is updated daily on week days.
Initial download of the metrics may take a while.