Fig. 6
Download original image
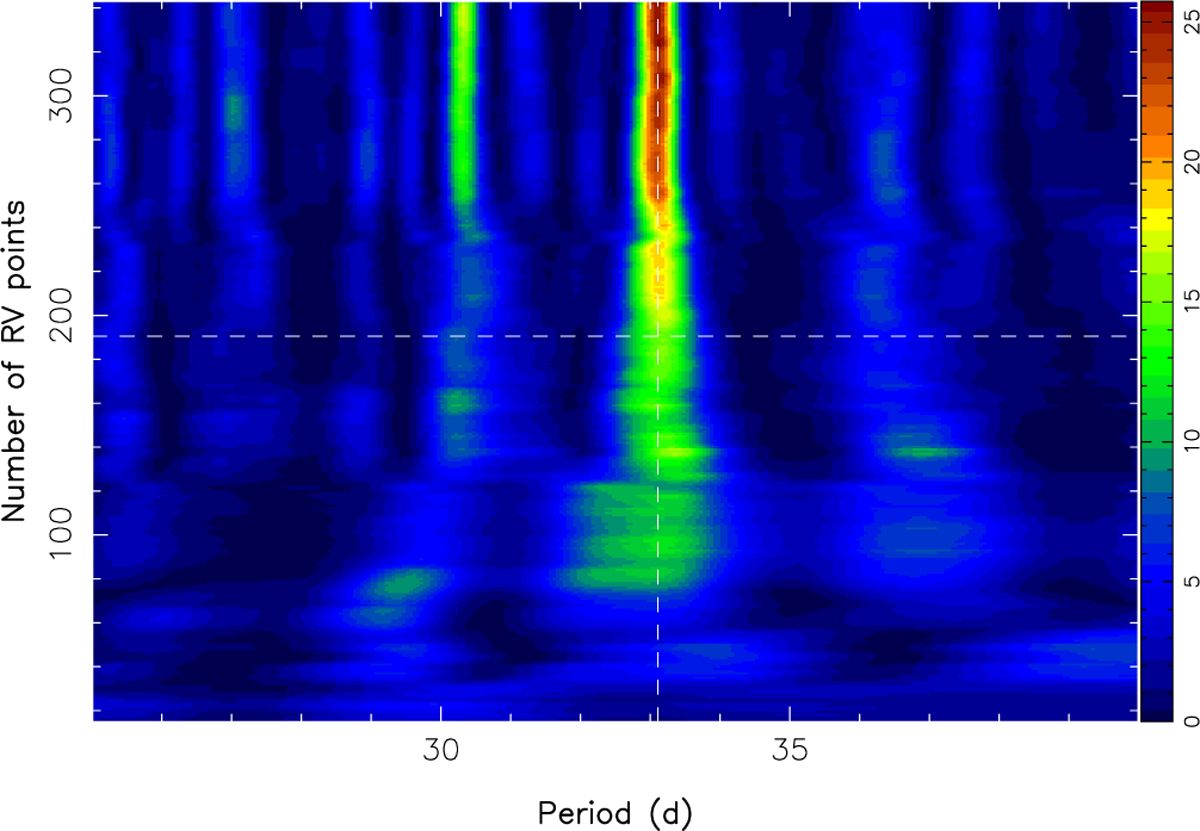
Stacked periodograms of the filtered RVs, as a function of the number of RV points included in the Fourier analysis, beginning from the first observation. The color scale indicates the logarithmic power in the periodogram. The main RV signal associated with candidate planet e, outlined with a vertical dashed line (see Table 1), becomes stronger and increasingly dominant in this period range as more spectra are added to the analysis. The horizontal dashed line illustrates the end of the previous data set (Donati et al. 2023a). The weaker peak at 30.3 d, also visible in the middle panel of Fig. 5, is a 1-yr alias of the main signal.
Current usage metrics show cumulative count of Article Views (full-text article views including HTML views, PDF and ePub downloads, according to the available data) and Abstracts Views on Vision4Press platform.
Data correspond to usage on the plateform after 2015. The current usage metrics is available 48-96 hours after online publication and is updated daily on week days.
Initial download of the metrics may take a while.