Fig. B.1.
Download original image
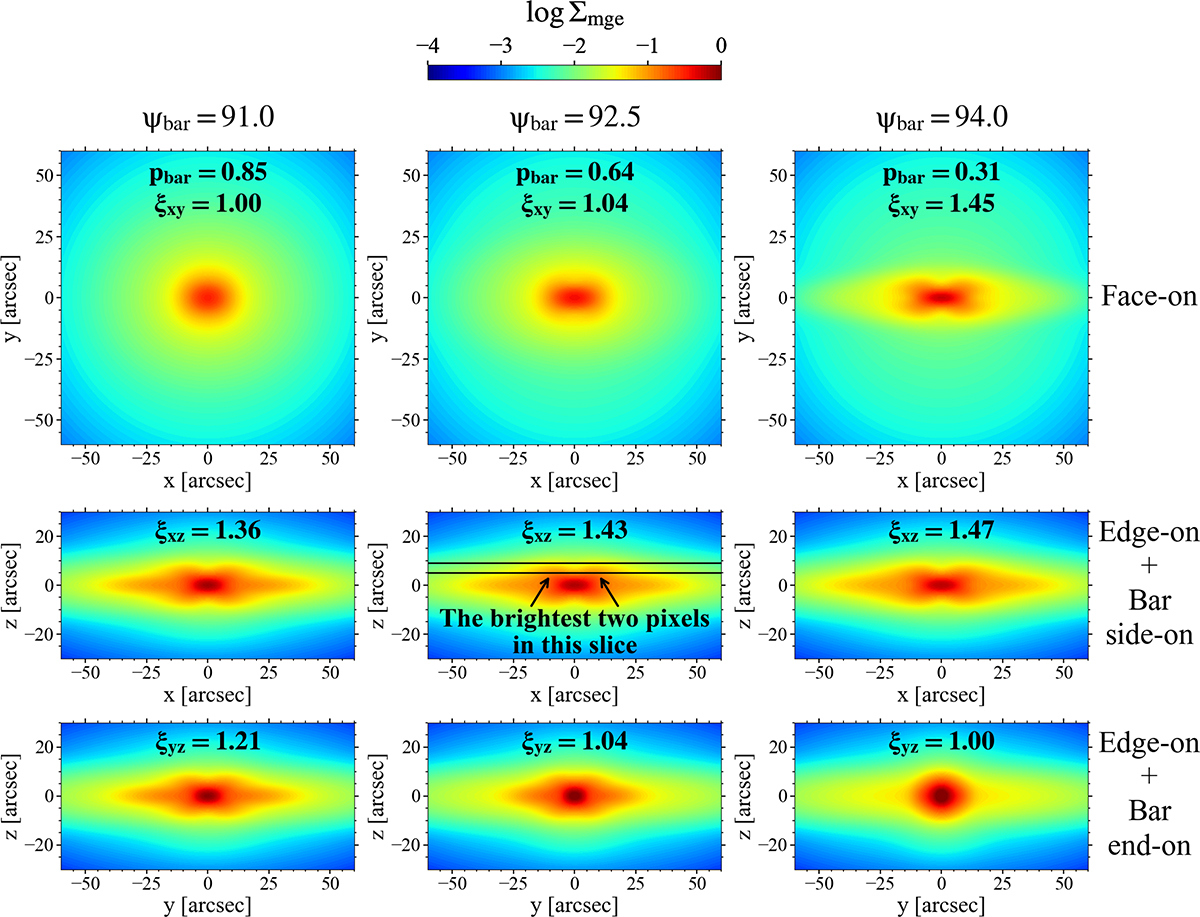
Variation of MGE-predicted luminosity distributions with bar position angles ψbar. All distributions are deprojected under the true viewing angles (θ, φ) = (θT, φT) = (85° ,50° ). From top to bottom, the panels show the normalised luminosity distributions in the intrinsic x-y, x-z, and y-z planes. From left to right, the bar position angles are ψbar = 91.0°, 92.5°, and 94.0°. The middle panels with ψ = 92.5° correspond to our chosen distribution and are the same as the middle panels in Fig. 4. The bar axis ratios pbar in the x-y plane and the values of the parameter ξ (defined in Eqs. 11–13) are labelled in the figure. The lines, arrows, and labels in the central panel illustrate the calculation of ξxz: we first divide the x-z plane into 1 arcsec-wide slices along the z-axis; for each slice, we calculate the brightness ratio between the brightest pixel and the central pixel, and finally select the maximum ratio across all slices as ξxz.
Current usage metrics show cumulative count of Article Views (full-text article views including HTML views, PDF and ePub downloads, according to the available data) and Abstracts Views on Vision4Press platform.
Data correspond to usage on the plateform after 2015. The current usage metrics is available 48-96 hours after online publication and is updated daily on week days.
Initial download of the metrics may take a while.