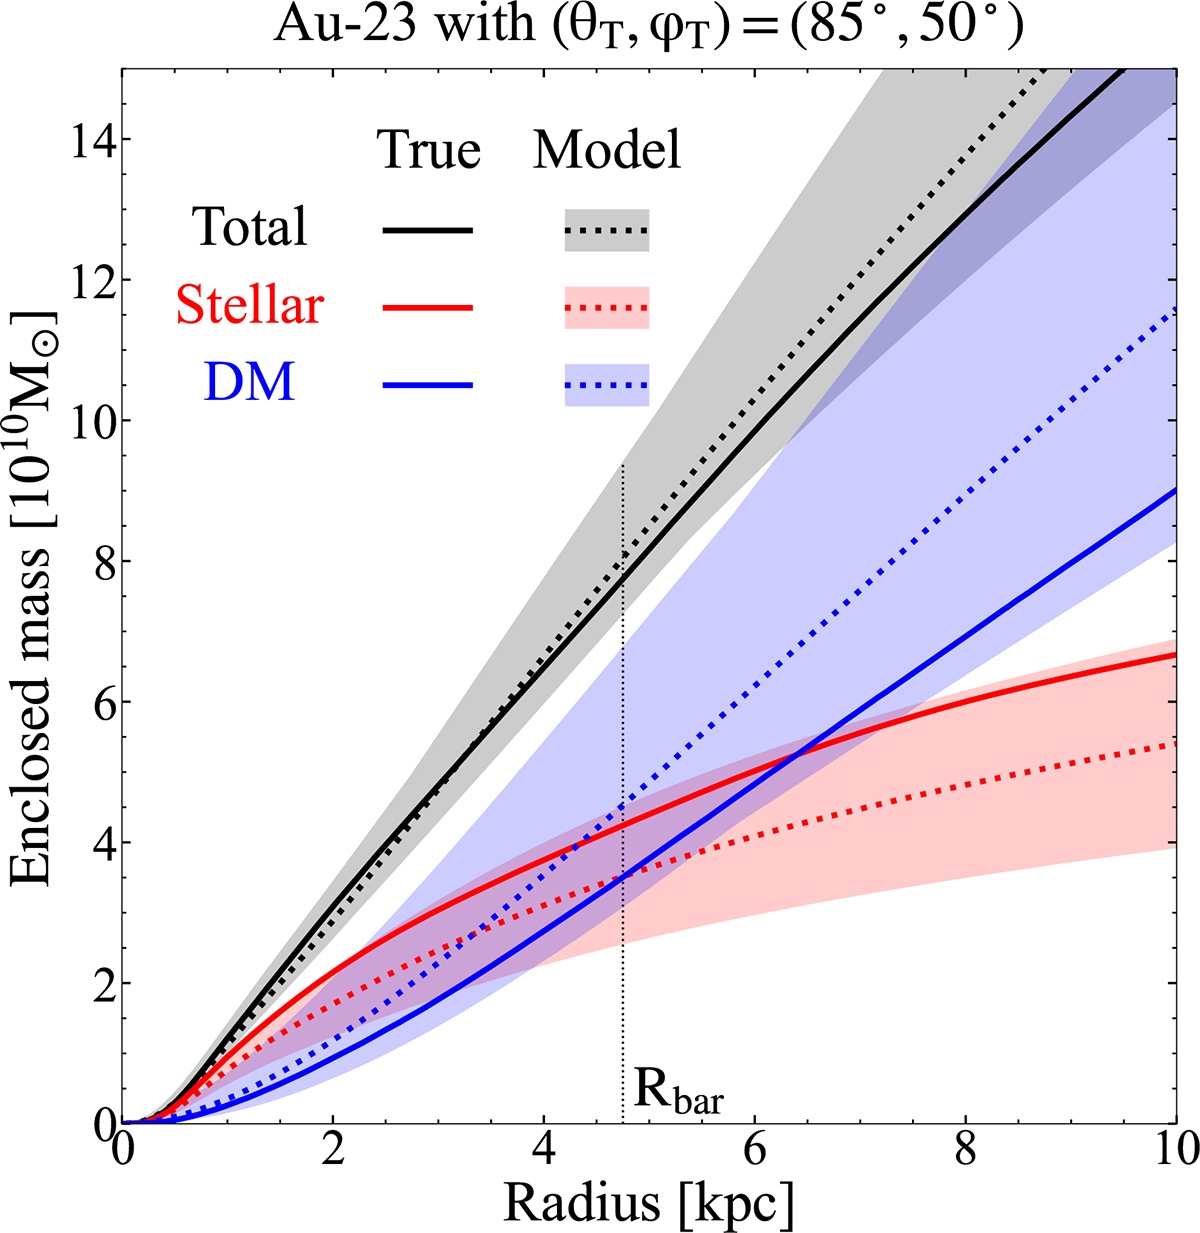
Fig. C.1.
Download original image
Enclosed mass profiles for Au-23-85-50 and comparisons with the true profiles. The black, red, and blue solid lines represent the true profiles of total mass, stellar mass, and dark matter mass, respectively. The corresponding dashed lines indicate the profiles of the best-fitting models, while the shadow regions denote the model uncertainties within 2σ confidence levels. The dotted vertical line represents the bar radius Rbar (half the bar length) from Blázquez-Calero et al. (2020).
Current usage metrics show cumulative count of Article Views (full-text article views including HTML views, PDF and ePub downloads, according to the available data) and Abstracts Views on Vision4Press platform.
Data correspond to usage on the plateform after 2015. The current usage metrics is available 48-96 hours after online publication and is updated daily on week days.
Initial download of the metrics may take a while.