Fig. E.1.
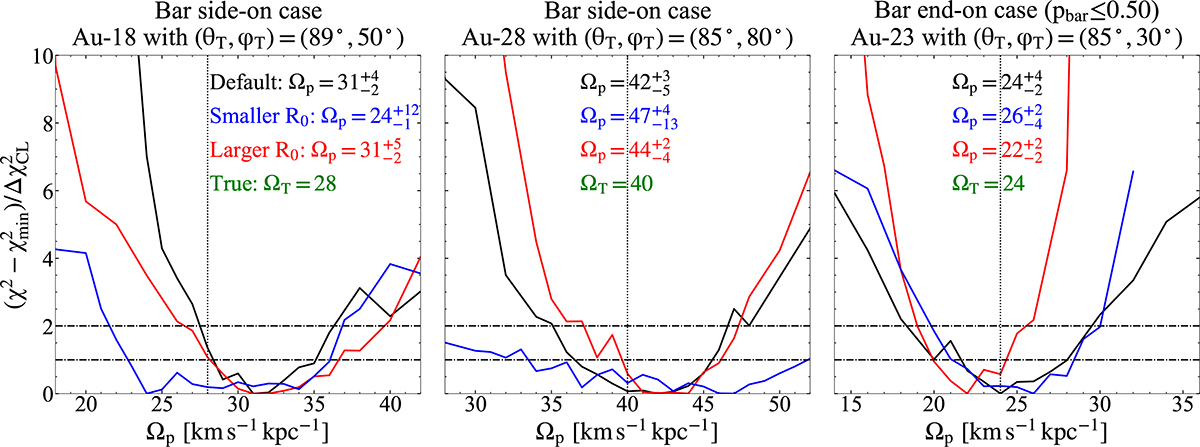
Download original image
Influence of separating radii R0 on marginalised chi-squares χnorm2 = (χ2 − χmin2)/ΔχCL2 versus model-recovered bar pattern speeds Ωp. From left to right: a bar side-on case Au-18-89-50, a bar side-on case Au-28-85-80, and a bar end-on case Au-23-85-30 under the strong bar assumption (pbar ≤ 0.50). Each fold line represents a complete set of modelling runs. The black fold lines denote the model results with default separating radii (R0 = R0,default), as previously displayed in Figs. 7 and 8, while the blue and red lines represent results with smaller (R0 = 0.6R0,default) and larger (R0 = 1.3R0,default) separating radii, respectively. The horizontal dashed lines represent 1σ (68%, χnorm2 = 1) and 2σ (95%, χnorm2 = 2) confidence levels. The vertical dotted lines denote the true bar pattern speeds, with their values shown by the green annotations.
Current usage metrics show cumulative count of Article Views (full-text article views including HTML views, PDF and ePub downloads, according to the available data) and Abstracts Views on Vision4Press platform.
Data correspond to usage on the plateform after 2015. The current usage metrics is available 48-96 hours after online publication and is updated daily on week days.
Initial download of the metrics may take a while.