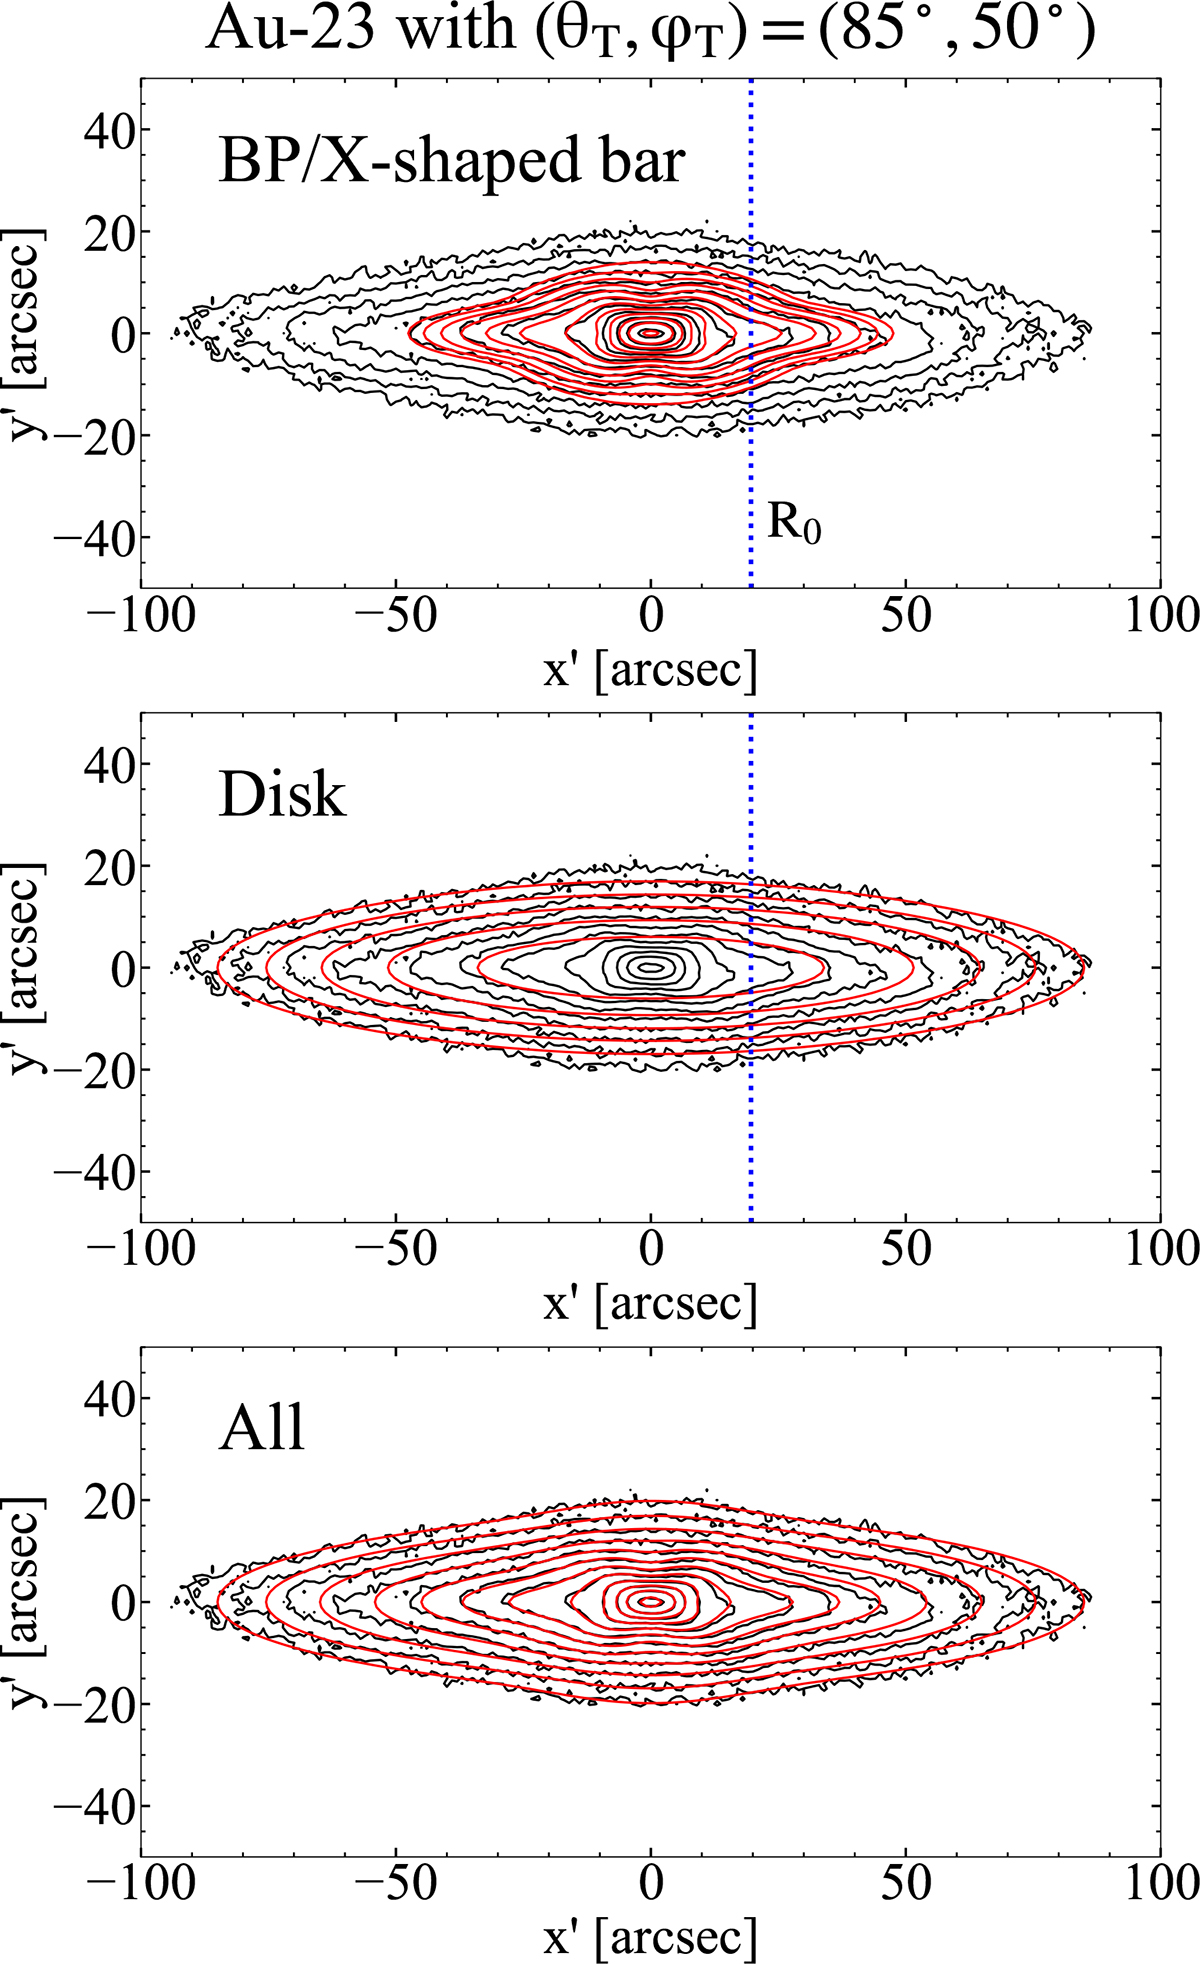
Fig. 3.
Download original image
True surface brightness contours and MGE fitting results in the observing plane x′-y′ for Au-23-85-50. The black contours in all panels represent the true surface brightness. The red contours in the top, middle and bottom panel denote the bar component with BP/X-shaped structure, the disk component and all components in the MGE fitting results, respectively. The contour interval is equal to 0.5 magnitude. The blue dashed line indicates the separating radius R0 that distinguishes Gaussians as either part of the bar component or the disk component in the MGE fitting process (see Eq. (1)).
Current usage metrics show cumulative count of Article Views (full-text article views including HTML views, PDF and ePub downloads, according to the available data) and Abstracts Views on Vision4Press platform.
Data correspond to usage on the plateform after 2015. The current usage metrics is available 48-96 hours after online publication and is updated daily on week days.
Initial download of the metrics may take a while.