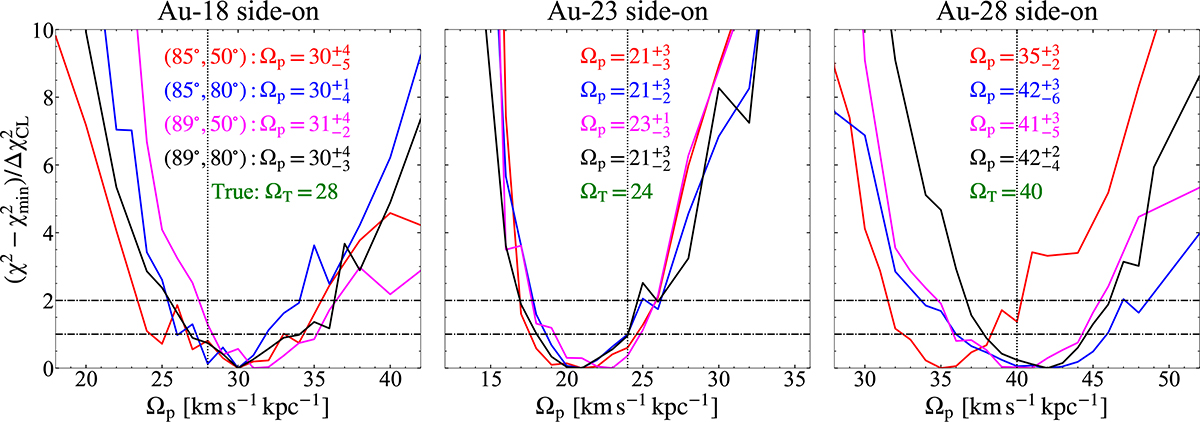
Fig. 7.
Download original image
Marginalised chi-squares χnorm2 = (χ2 − χmin2)/ΔχCL2 as a function of model-recovered bar pattern speeds Ωp for bar side-on cases (φT ≥ 50°). From left to right, the panels show the results for Au-18, Au-23, and Au-28. Each fold line represents a complete set of modelling runs. The red, blue, magenta, black fold lines denote the viewing angles of the mock data sets (θT, φT) = (85° ,50° ), (85° ,80° ), (89° ,50° ), and (89° ,80° ), respectively. The horizontal dashed lines represent 1σ (68%, χnorm2 = 1) and 2σ (95%, χnorm2 = 2) confidence levels. The vertical dotted lines denote the true bar pattern speeds, with their values shown by the green annotations.
Current usage metrics show cumulative count of Article Views (full-text article views including HTML views, PDF and ePub downloads, according to the available data) and Abstracts Views on Vision4Press platform.
Data correspond to usage on the plateform after 2015. The current usage metrics is available 48-96 hours after online publication and is updated daily on week days.
Initial download of the metrics may take a while.