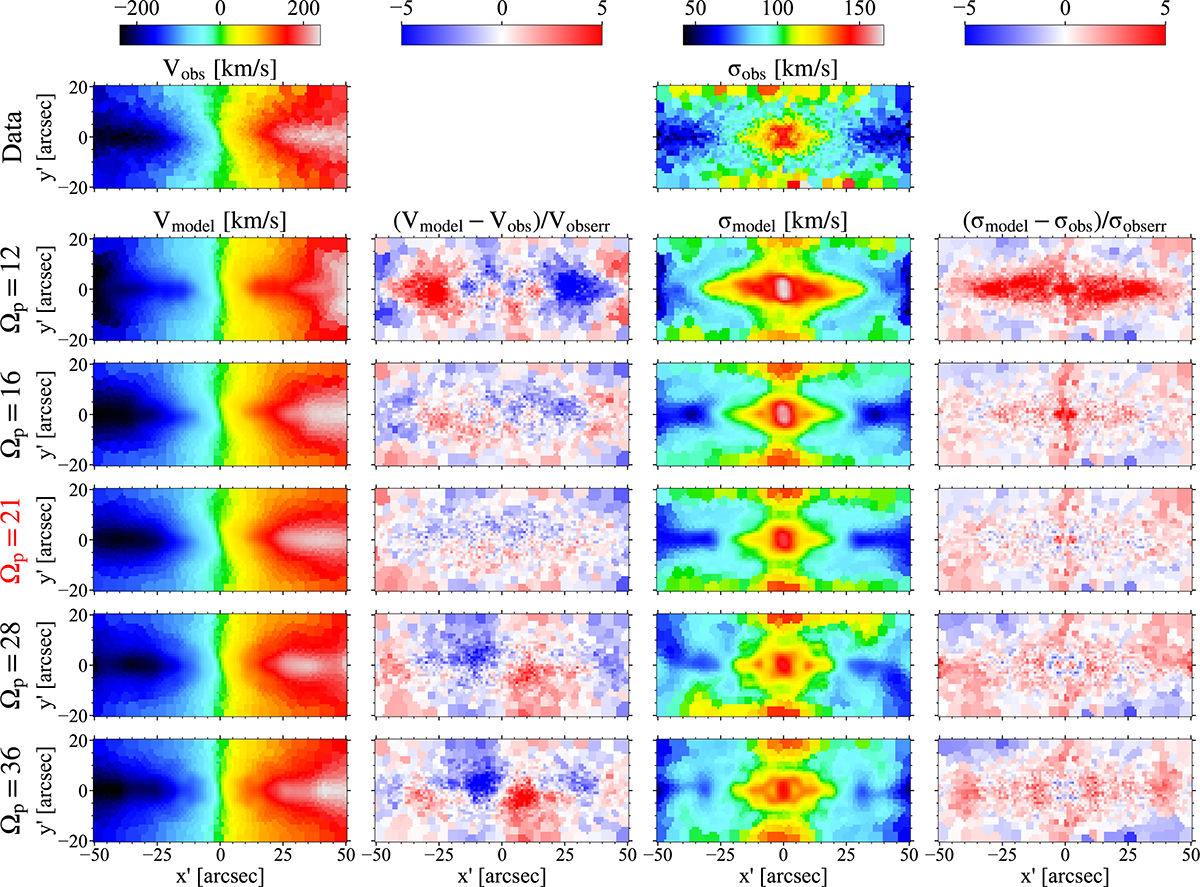
Fig. 9.
Download original image
Influence of Ωp on the mean velocity and velocity dispersion maps for Au-23-85-50. The topmost two panels represent the mock mean velocity Vobs and velocity dispersion σobs maps. From the second row to the sixth row, each row denotes a model. The fourth row with Ωp = 21 km s−1 kpc−1 represents the best-fitting model, while the remaining rows represent the model fitting results with only a change in Ωp. From left to right: mean velocity Vmodel, standardised residual of mean velocity (Vmodel − Vobs)/Vobs, velocity dispersion σmodel, and standardised residual of velocity dispersion (σmodel − σobs)/σobs.
Current usage metrics show cumulative count of Article Views (full-text article views including HTML views, PDF and ePub downloads, according to the available data) and Abstracts Views on Vision4Press platform.
Data correspond to usage on the plateform after 2015. The current usage metrics is available 48-96 hours after online publication and is updated daily on week days.
Initial download of the metrics may take a while.