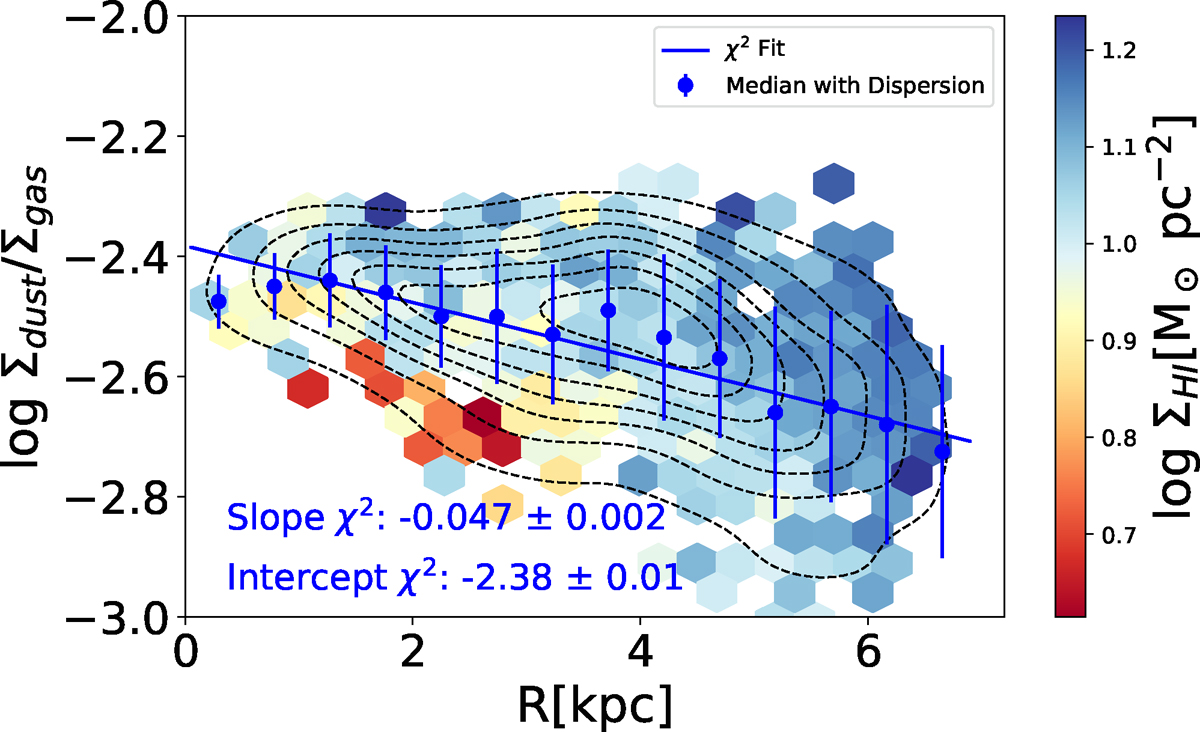
Fig. C.3.
Download original image
Dust-to-gas mass surface density ratio Σdust/Σgas in apertures with Ra = 30 arcsec as a function of galactocentric radius R. Hexagons are color coded according to the atomic gas surface density ΣHI, given by the colorbars, The blue line shows the linear fit to the data as given by χ2 minimization. After radial binning, the median values and their dispersion are shown with filled blue circles and vertical blue bars, respectively. The dashed lines indicate the density of data points.
Current usage metrics show cumulative count of Article Views (full-text article views including HTML views, PDF and ePub downloads, according to the available data) and Abstracts Views on Vision4Press platform.
Data correspond to usage on the plateform after 2015. The current usage metrics is available 48-96 hours after online publication and is updated daily on week days.
Initial download of the metrics may take a while.