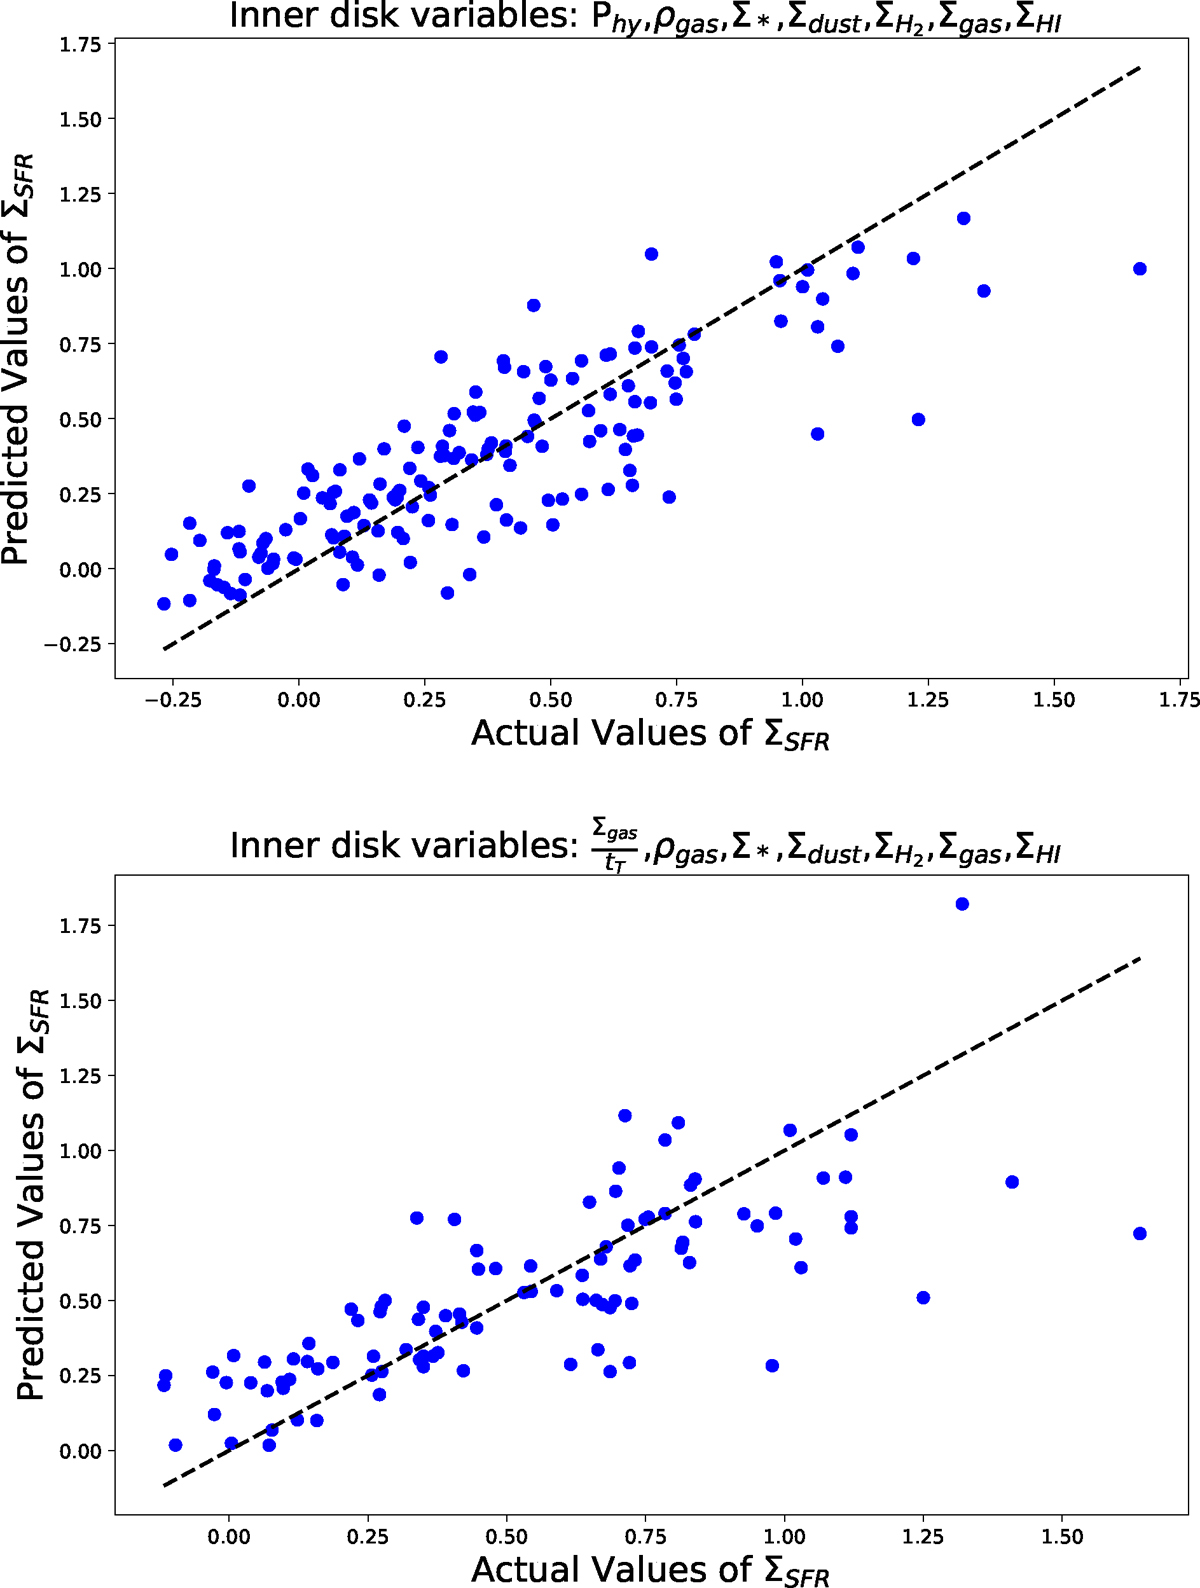
Fig. 8.
Download original image
RF predicted values of ΣSFR versus its actual values are shown for the inner disk when the physical variables listed above the panels are examined. In the top panel, all the inner disk data has been included, while the bottom panel only shows regions with Q < 1. The relative importance of these variables are shown in the central panel of Figure 7. The dashed line of unity slope has been drawn for reference.
Current usage metrics show cumulative count of Article Views (full-text article views including HTML views, PDF and ePub downloads, according to the available data) and Abstracts Views on Vision4Press platform.
Data correspond to usage on the plateform after 2015. The current usage metrics is available 48-96 hours after online publication and is updated daily on week days.
Initial download of the metrics may take a while.