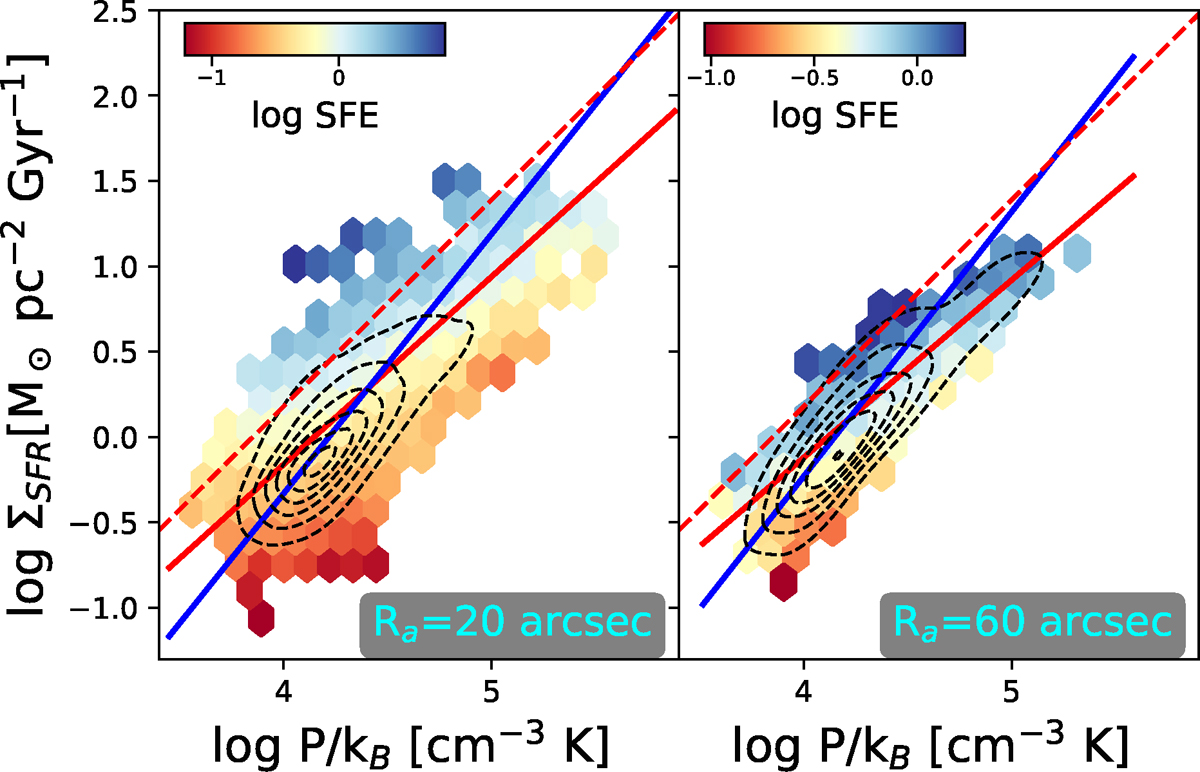
Fig. 9.
Download original image
log Phy–log ΣSFR relation is shown by varying the size of the sampled regions. Left panel: Ra = 20 arcsec. Right panel: Ra = 60 arcsec. The dashed red line shows the relation predicted by the OK22 model. Color-coding is done with log SFE, which is the effective SFE per molecular mass surface density in Gyr−1. The red and blue straight lines show the best fitted linear relations for ODR for the inner and outer disk, respectively. Dashed contours indicate the density of data in the plane.
Current usage metrics show cumulative count of Article Views (full-text article views including HTML views, PDF and ePub downloads, according to the available data) and Abstracts Views on Vision4Press platform.
Data correspond to usage on the plateform after 2015. The current usage metrics is available 48-96 hours after online publication and is updated daily on week days.
Initial download of the metrics may take a while.