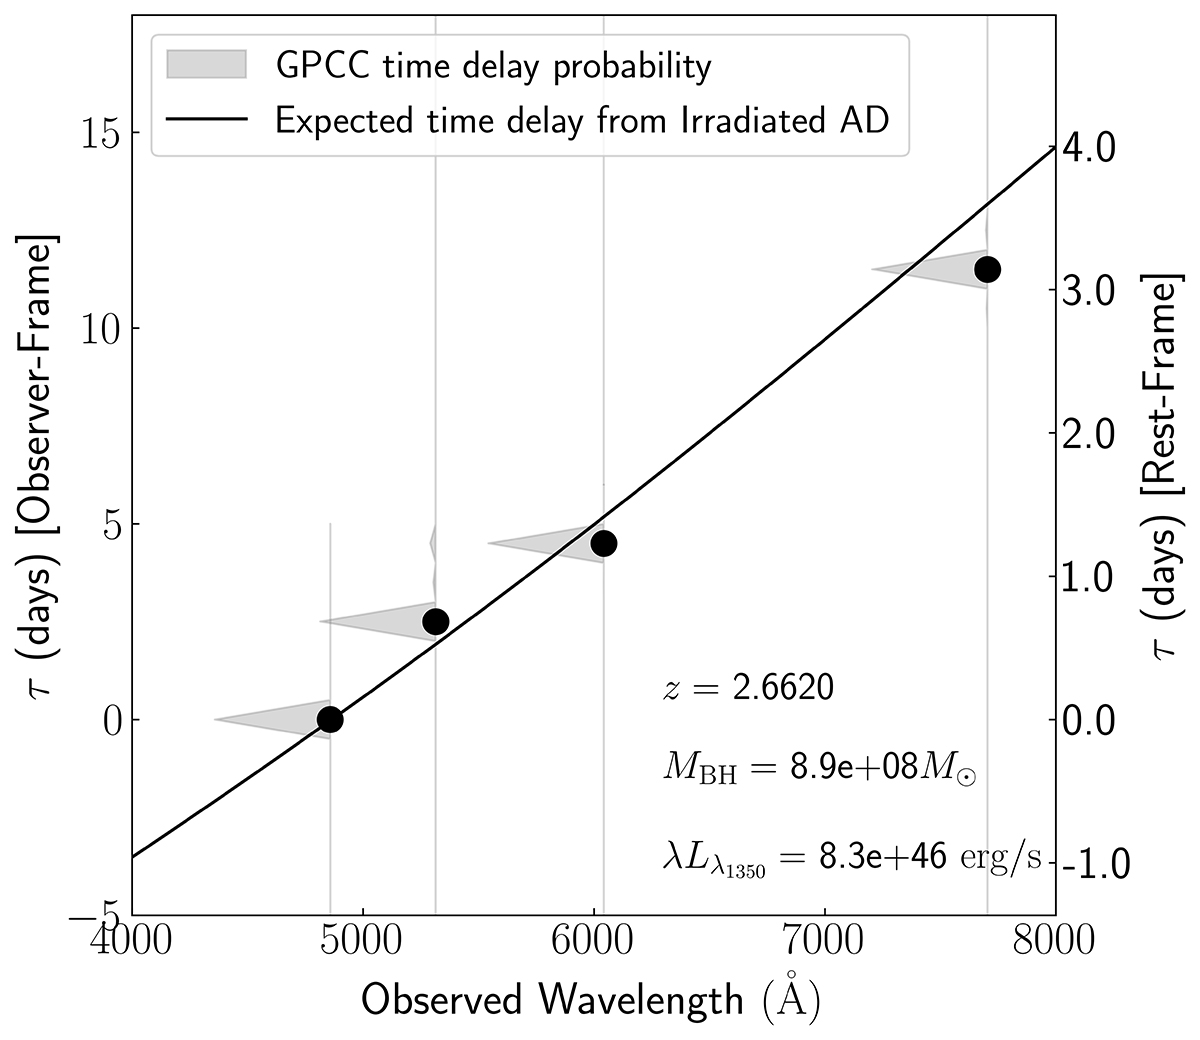
Fig. 2.
Download original image
Observed time delay spectrum. The shaded regions represent the time delay (τ) probability distributions obtained using the GPCC method (Pozo Nuñez et al. 2023b), with black dots indicating the most likely delay corresponding to the peak of each distribution. The solid line denotes the expected delay from an optically thick, geometrically thin accretion disc irradiated by a lamp post geometry. A summary of the physical parameters used in the model, including the black hole mass (MBH), luminosity (λLλ1350), and redshift (z), is provided.
Current usage metrics show cumulative count of Article Views (full-text article views including HTML views, PDF and ePub downloads, according to the available data) and Abstracts Views on Vision4Press platform.
Data correspond to usage on the plateform after 2015. The current usage metrics is available 48-96 hours after online publication and is updated daily on week days.
Initial download of the metrics may take a while.