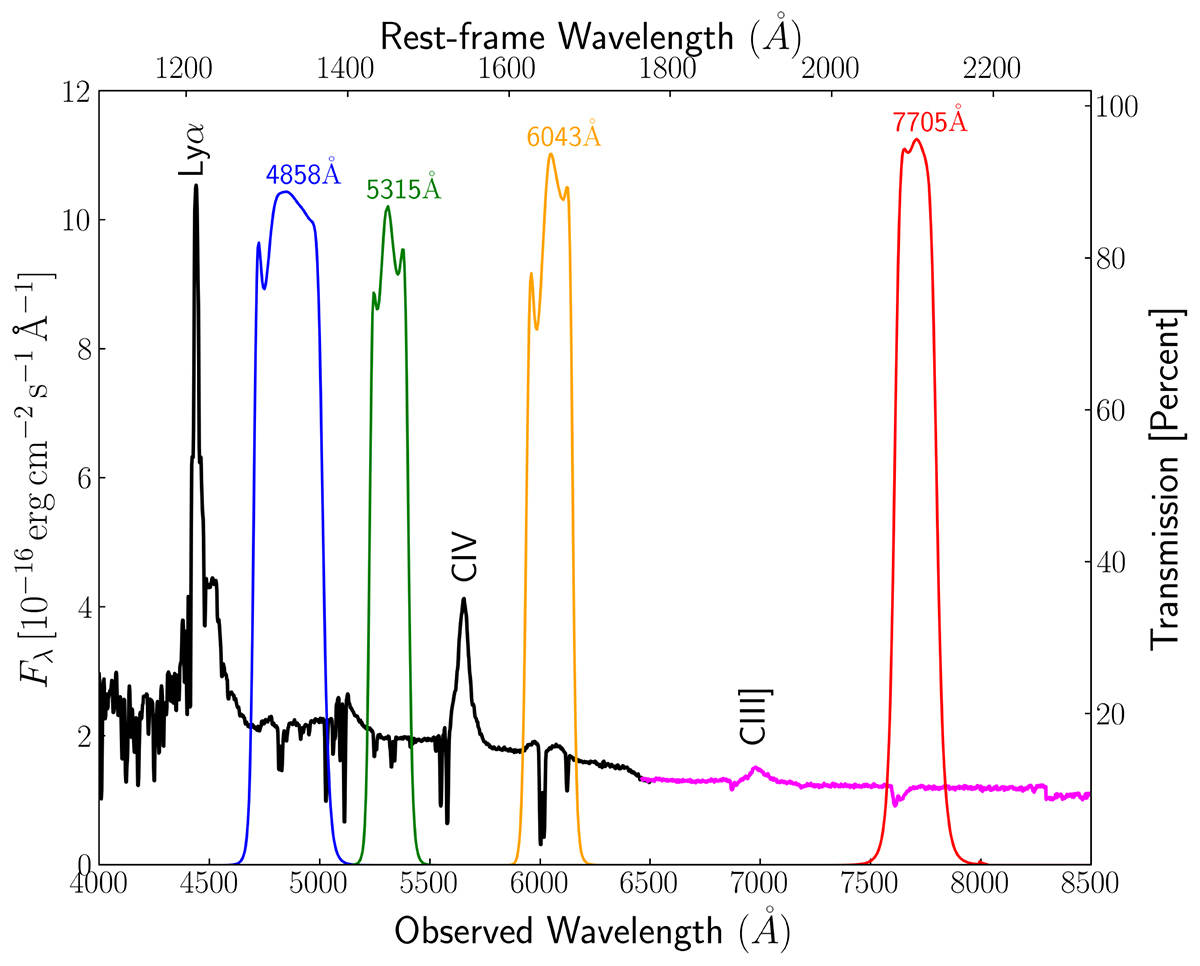
Fig. A.2.
Download original image
Effective transmission of the medium-band filters used in the monitoring. The coloured lines show the transmission profiles of the WFI medium-band filters. These profiles represent the measured filter transmission functions and do not include convolution with the quantum efficiency of the WFI camera. Overlaid in black is the spectrum of QSO J0455-4216 observed with SOAR, with relevant emission lines indicated. These filters predominantly capture the AGN continuum variations free of strong emission lines near the C IV and CIII] features. In particular, the 4858Å band measures the rest-frame flux at 1350Å and is used as a reference to determine time delays. The 6043Å filter includes the HeIIλ1640 emission line and a local absorption feature; however, together they contribute less than 2% of the integrated flux in this band and are not expected to significantly affect the measured continuum time delays. The portion of the spectrum extending beyond the maximum coverage of Goodman Spectrograph in its Blue configuration (> 6500Å) is shown in magenta and taken from Lira et al. (2018) (private communication).
Current usage metrics show cumulative count of Article Views (full-text article views including HTML views, PDF and ePub downloads, according to the available data) and Abstracts Views on Vision4Press platform.
Data correspond to usage on the plateform after 2015. The current usage metrics is available 48-96 hours after online publication and is updated daily on week days.
Initial download of the metrics may take a while.