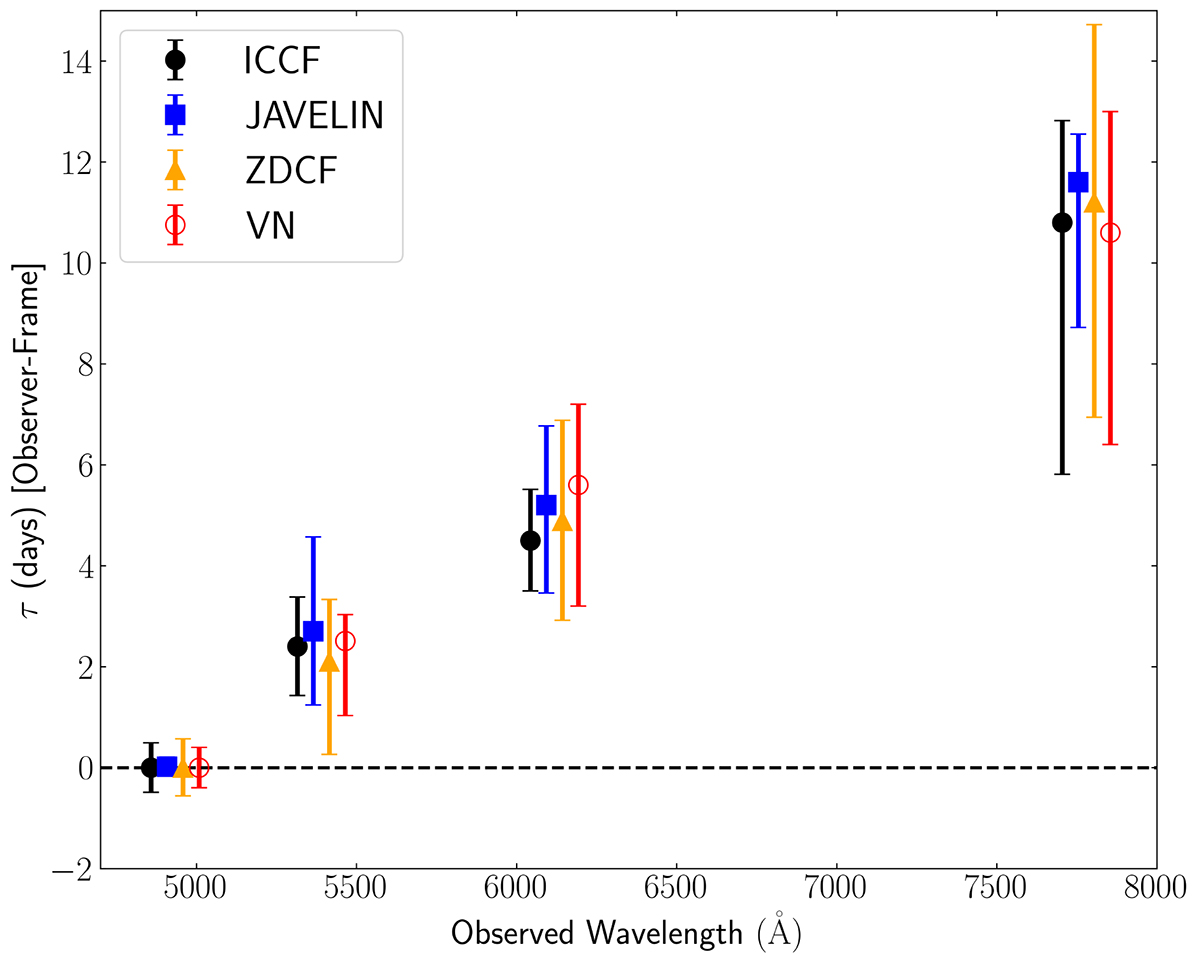
Fig. B.1.
Download original image
Observed time delay spectrum for multiple delay estimation methods. Time delays were measured using the interpolated cross-correlation function (ICCF; Gaskell & Peterson 1987 black circles), JAVELIN (Zu et al. 2011) damped random walk modelling (blue squares), the z-transformed discrete correlation function (ZDCF; Alexander 1997 yellow triangles), and the von Neumann statistical estimator (VN; Chelouche et al. 2017 red open circles), with error bars corresponding to 1σ uncertainties. A small shift in wavelength has been introduced for clarity. The close agreement between delays obtained by different methods demonstrates the robustness of the measurements, supporting the reliability of the wavelength-dependent delay structure observed in the quasar’s variability.
Current usage metrics show cumulative count of Article Views (full-text article views including HTML views, PDF and ePub downloads, according to the available data) and Abstracts Views on Vision4Press platform.
Data correspond to usage on the plateform after 2015. The current usage metrics is available 48-96 hours after online publication and is updated daily on week days.
Initial download of the metrics may take a while.