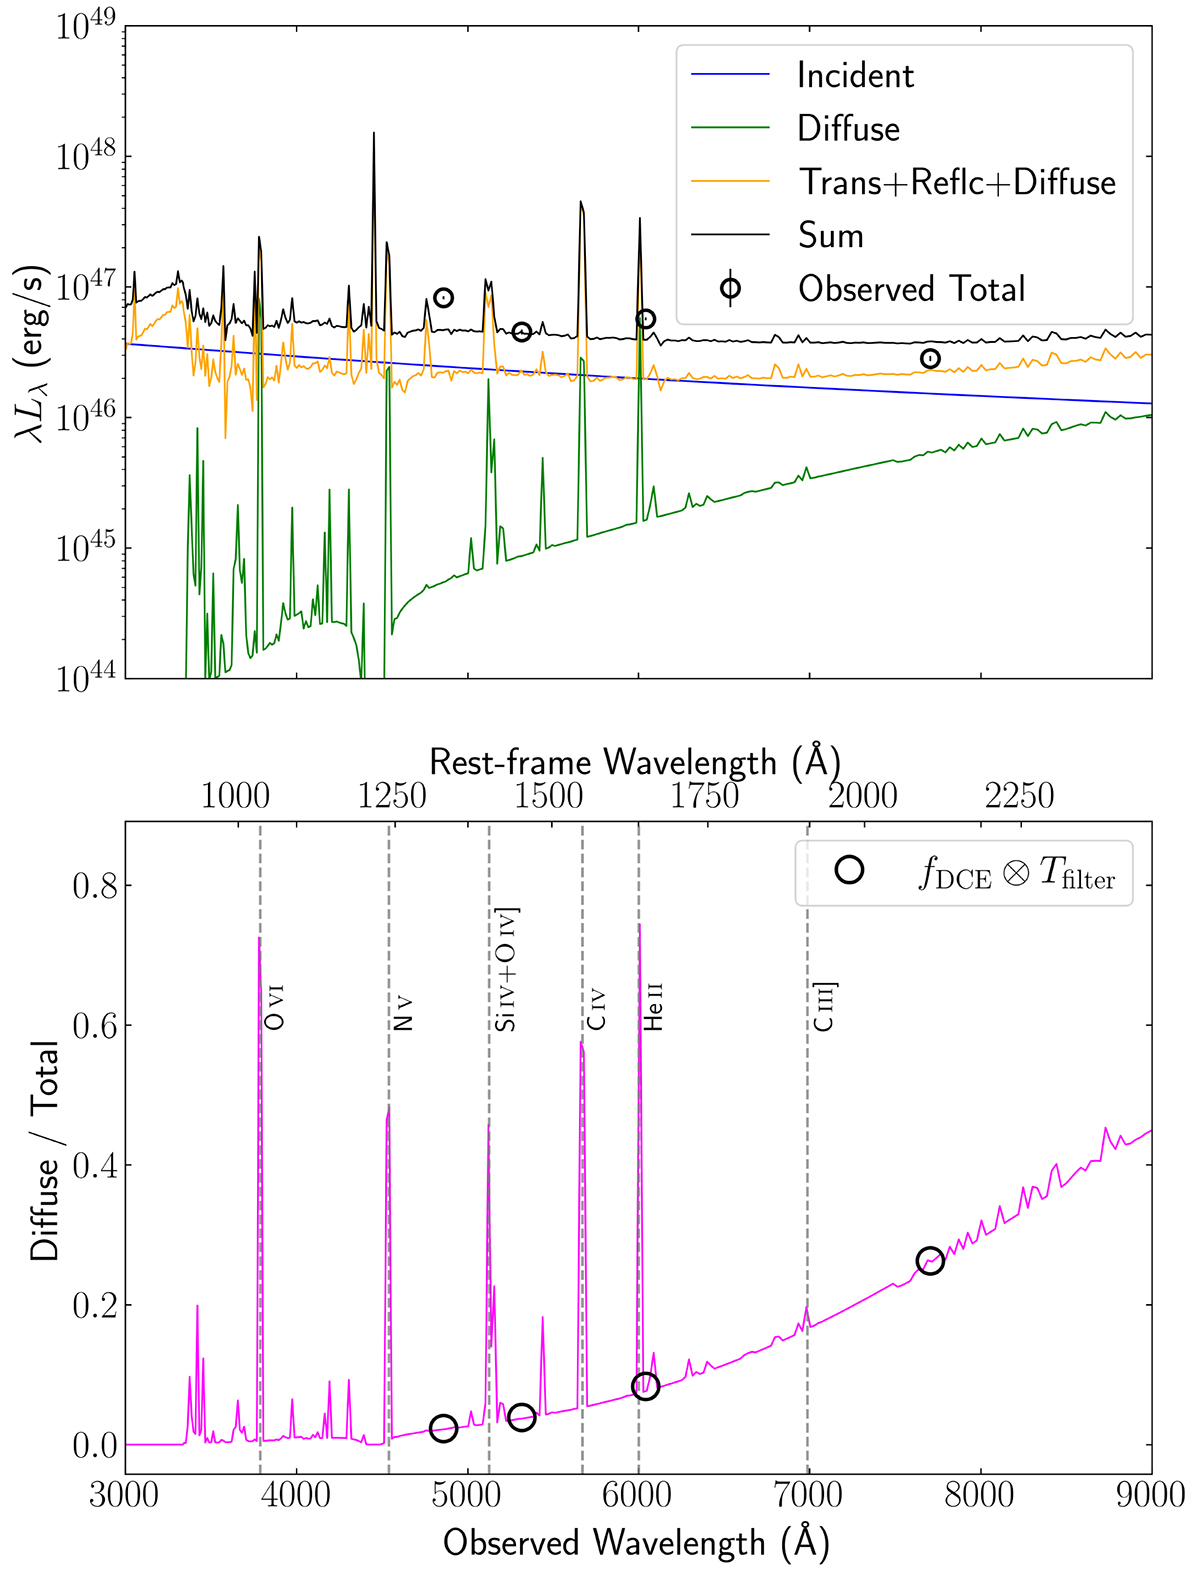
Fig. C.1.
Download original image
Photoionisation simulations and DCE fraction. Top: Luminosity contributions from various components are shown as a function of wavelength. The blue curve represents the incident emission, i.e. the intrinsic continuum irradiating the BLR clouds. The green curve shows the diffuse emission from photoionised gas within the BLR. The orange curve is the sum of transmitted, reflected, and diffuse components. The black curve represents the total emission model (sum of all components), which is in good qualitative agreement with the observed total emission (black circles) derived from the photometric light curves. Bottom: Fractional contribution of DCE to the total emission is plotted in magenta. Prominent DCE features linked to major BLR emission regions are marked in the bottom panel. The black circles indicate the effective DCE fractions integrated over the photometric filter bands employed in this study (see text for details). An accompanying animation is available online, illustrating the full range of DCE contributions and their progressive impact on the light curve.
Current usage metrics show cumulative count of Article Views (full-text article views including HTML views, PDF and ePub downloads, according to the available data) and Abstracts Views on Vision4Press platform.
Data correspond to usage on the plateform after 2015. The current usage metrics is available 48-96 hours after online publication and is updated daily on week days.
Initial download of the metrics may take a while.