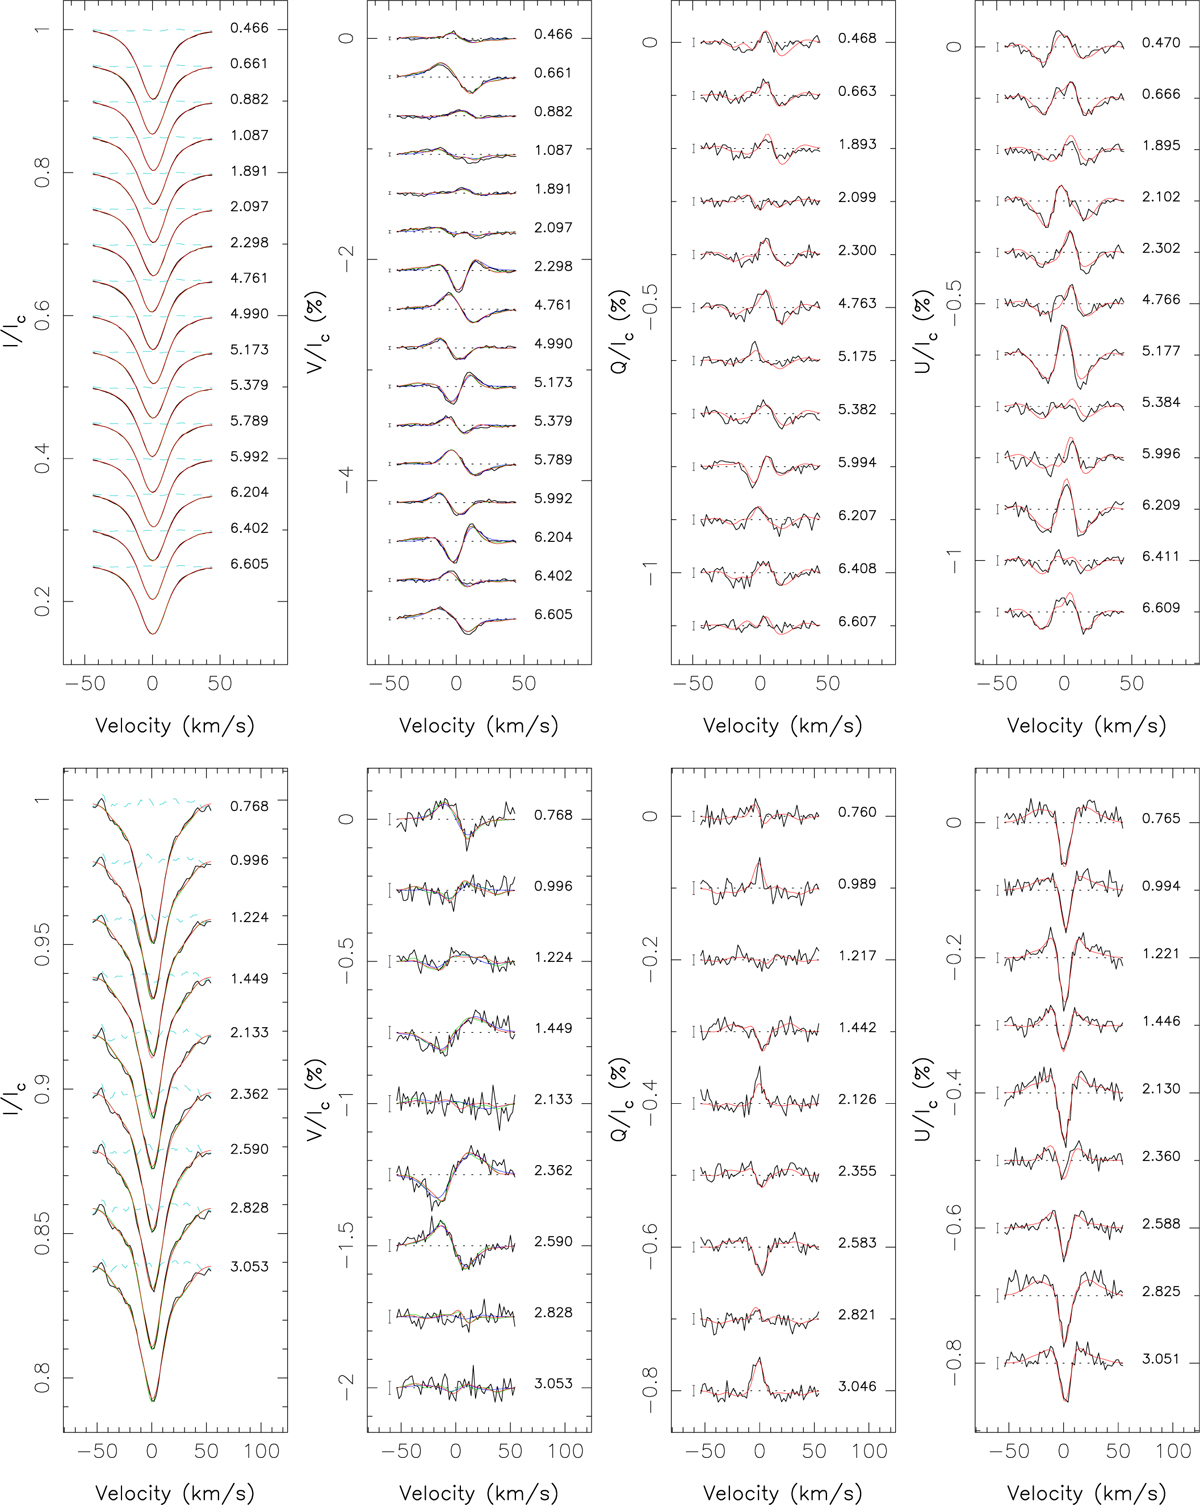
Fig. 1
Download original image
Observed (thick black line) and modeled (thin color line) LSD Stokes I, V, Q and U profiles (from left to right) of AU Mic (top row) and EV Lac (bottom row). The thin blue, green and red lines correspond, respectively, to the Stokes V, Stokes IV and Stokes IVQU ZDI fits to the LSD profiles; the cyan dashed lines in the left panels illustrate the difference between the observations and the Stokes IVQU ZDI fit. Rotation cycles are indicated to the right of LSD profiles, and ±1σ error bars are shown to the left of the Stokes VQU signatures.
Current usage metrics show cumulative count of Article Views (full-text article views including HTML views, PDF and ePub downloads, according to the available data) and Abstracts Views on Vision4Press platform.
Data correspond to usage on the plateform after 2015. The current usage metrics is available 48-96 hours after online publication and is updated daily on week days.
Initial download of the metrics may take a while.