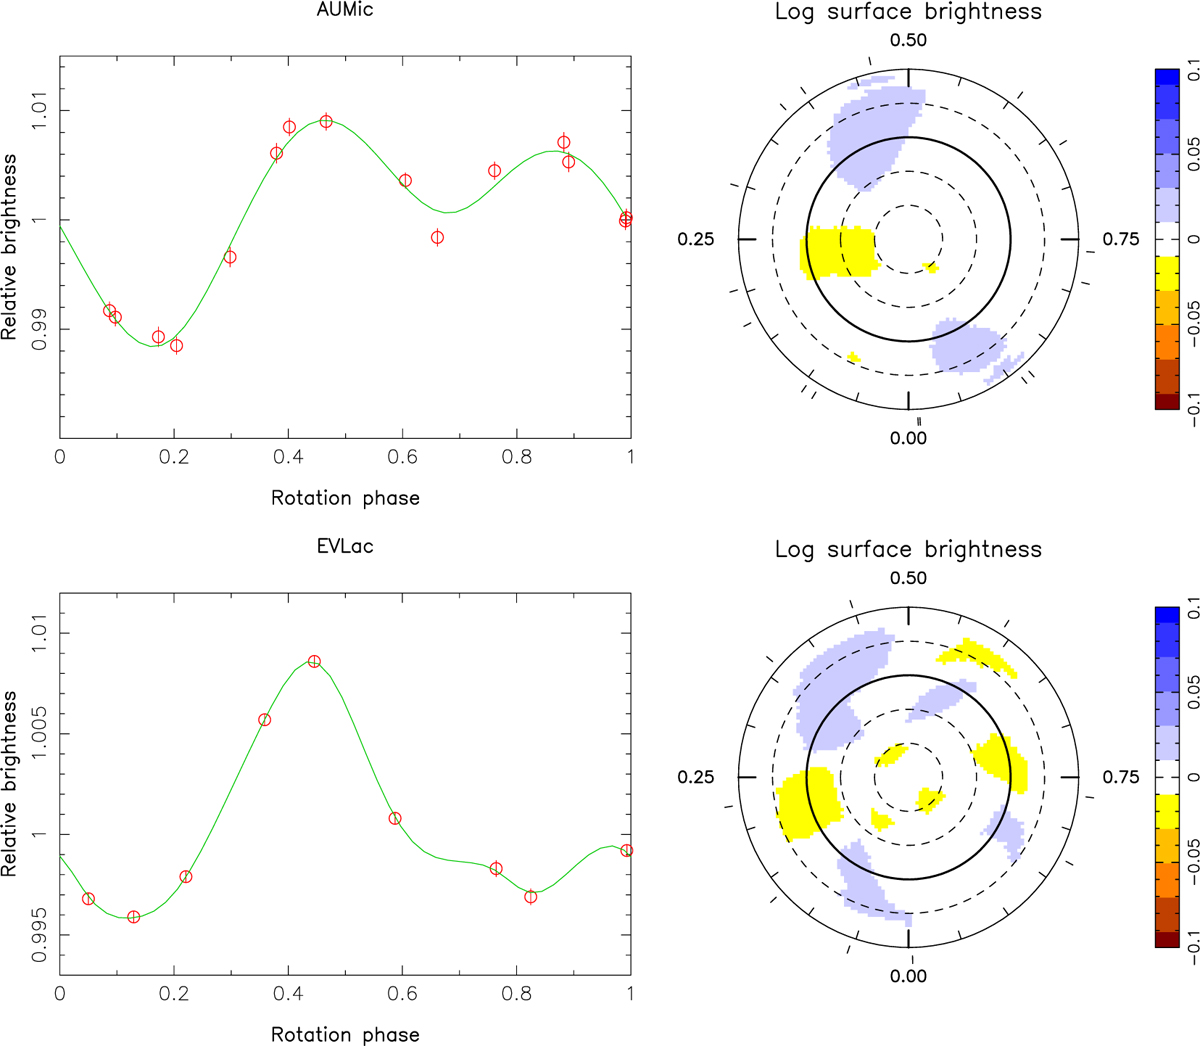
Fig. 4
Download original image
Photometric light curves inferred from dT estimates (red circles, left panels) with ZDI fits (green curves), and brightness maps (right panels) reconstructed simultaneously with the magnetic maps of Figs. 2 and 3, for both AU Mic (top row) and EV Lac (bottom row), in the case of Stokes IVQU reconstructions. Very similar results are obtained in Stokes IV reconstructions. The brightness maps are shown as in Figs. 2 and 3, with yellow and blue depicting regions darker and brighter than the quiet photosphere, respectively.
Current usage metrics show cumulative count of Article Views (full-text article views including HTML views, PDF and ePub downloads, according to the available data) and Abstracts Views on Vision4Press platform.
Data correspond to usage on the plateform after 2015. The current usage metrics is available 48-96 hours after online publication and is updated daily on week days.
Initial download of the metrics may take a while.