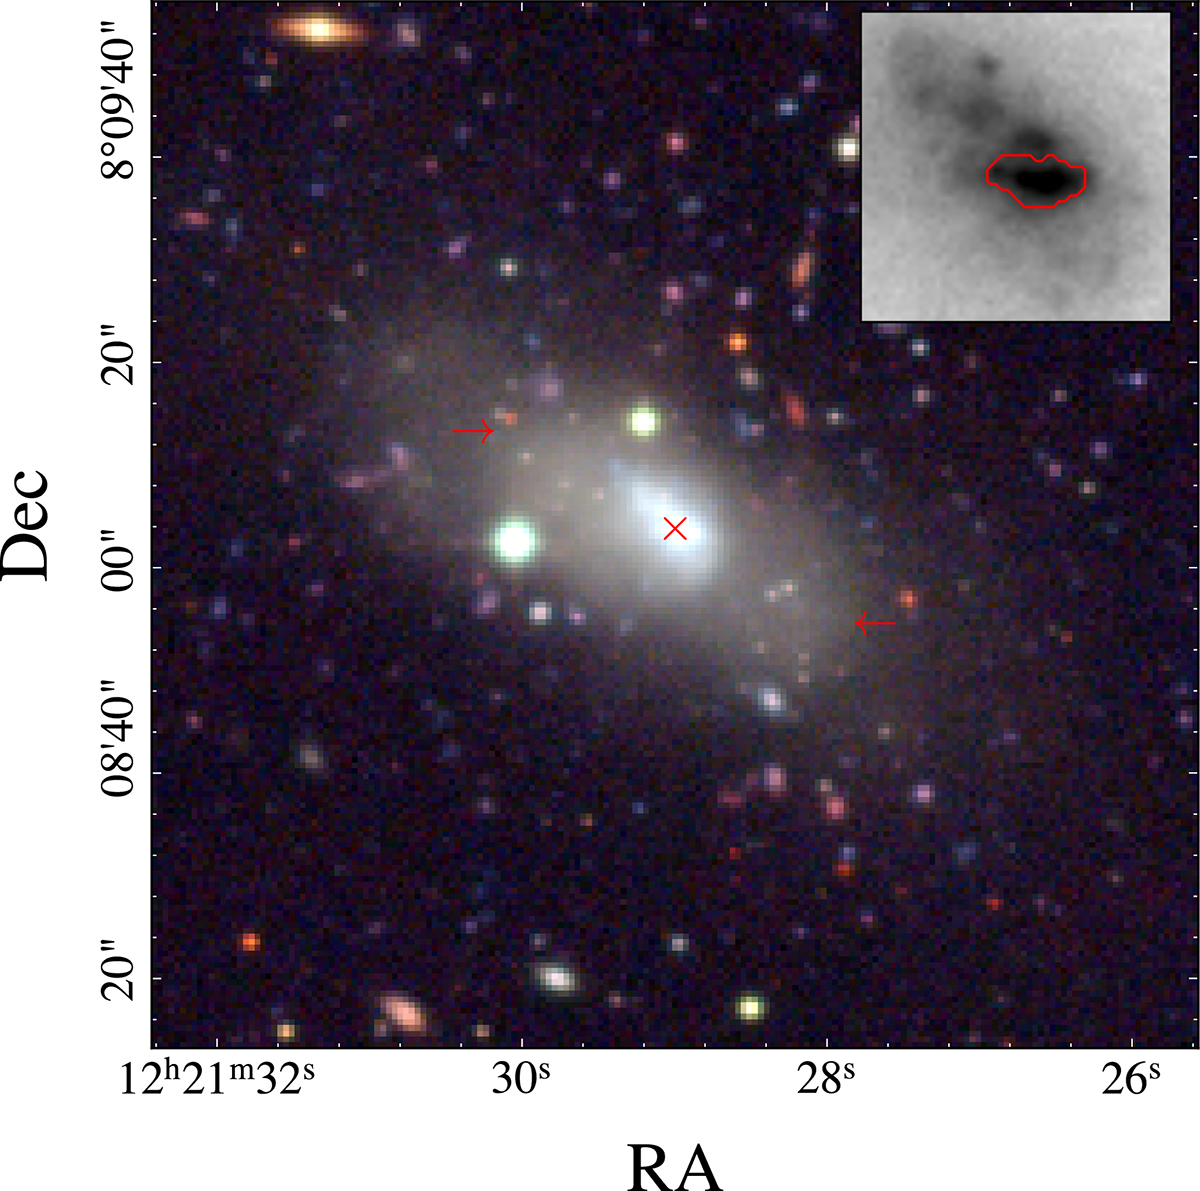
Fig. 1.
Download original image
Color composite image made from NGVS u-, g-, and i-band data. The red cross represents the galaxy center. We indicate the location of the stellar shells with two red arrows. In the top right corner, we present a zoomed-in i-band image of the central 10 arcsec region. The brightest star clusters detected by photutils are delineated with a red contour.
Current usage metrics show cumulative count of Article Views (full-text article views including HTML views, PDF and ePub downloads, according to the available data) and Abstracts Views on Vision4Press platform.
Data correspond to usage on the plateform after 2015. The current usage metrics is available 48-96 hours after online publication and is updated daily on week days.
Initial download of the metrics may take a while.