Fig. 11.
Download original image
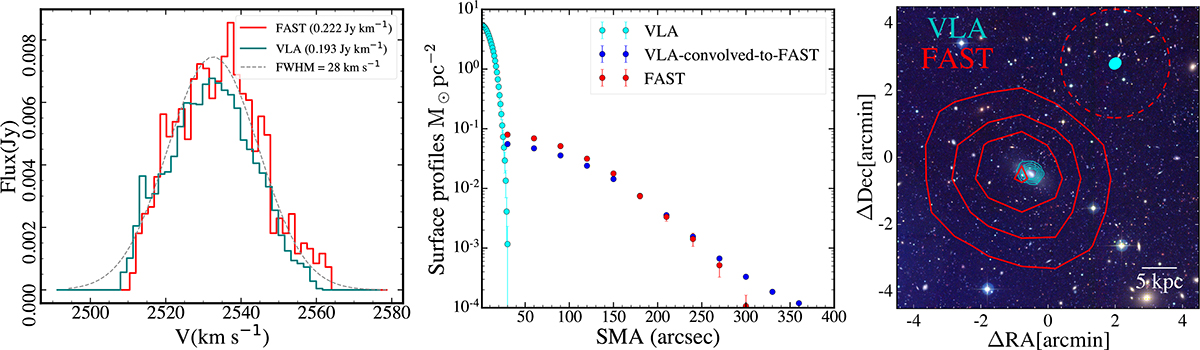
Left panel: Comparison of the FAST and VLA integrated HI spectra. Only pixels with S/N > 3 are incorporated in the velocity profiles. The total HI flux densities from the two telescopes are indicated in the legend. The dashed curve shows the best-fit Gaussian profile to the FAST HI spectrum, yielding a FWHM of 28 km s−1. Middle panel: Radial profiles of HI column densities derived from VLA and FAST. Radial profile derived from the VLA map that is smoothed to match the FAST beam (FWHM ∼ 3.24 arcmin) is also plotted for comparison. Right panel: HI intensity contours of VLA and FAST overplotted on the NGVS color image. The red curves denote the FAST HI (1, 3, 5, 7) × 1018 cm−2 column density contours. The cyan curves represent the VLA HI (3, 10, 20, 30, 40) × 7 × 1018 cm−2 column density contours. The FAST beam and the VLA synthesized beam are shown in the upper right corner as a dashed red circle and a cyan-filled ellipse, respectively. Note that the tapered natural weighted VLA HI image cube is used here.
Current usage metrics show cumulative count of Article Views (full-text article views including HTML views, PDF and ePub downloads, according to the available data) and Abstracts Views on Vision4Press platform.
Data correspond to usage on the plateform after 2015. The current usage metrics is available 48-96 hours after online publication and is updated daily on week days.
Initial download of the metrics may take a while.