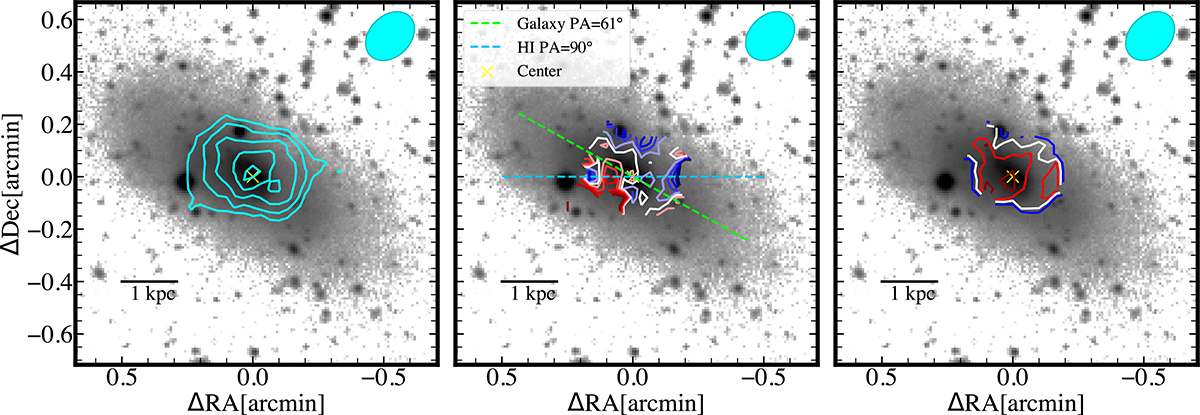
Fig. 12.
Download original image
Natural weighted HI moment maps of VLA overlaid on the NGVS g-band image. Left panel: Contours of the moment 0 (i.e., intensity) map plotted as cyan curves. The contours are respectively for HI column densities of (3, 10, 20, 30, 40) × 1.9 × 1019 cm−2. Middle panel: HI velocity field contours drawn at 2 km s−1 intervals. The white contour represents the systemic velocity of 2531 km s−1. The galaxy’s optical and HI major axes are shown as dashed lines in lime (PA = 61°) and blue (PA = 90° with maximum velocity gradient), respectively. Right panel: HI velocity dispersion contours drawn at 3, 6, 9, 12 km s−1. The yellow cross marks the optical center of VCC 479. The synthesized beam is represented by a cyan-filled ellipse in the upper right corner of each panel.
Current usage metrics show cumulative count of Article Views (full-text article views including HTML views, PDF and ePub downloads, according to the available data) and Abstracts Views on Vision4Press platform.
Data correspond to usage on the plateform after 2015. The current usage metrics is available 48-96 hours after online publication and is updated daily on week days.
Initial download of the metrics may take a while.