Fig. 13.
Download original image
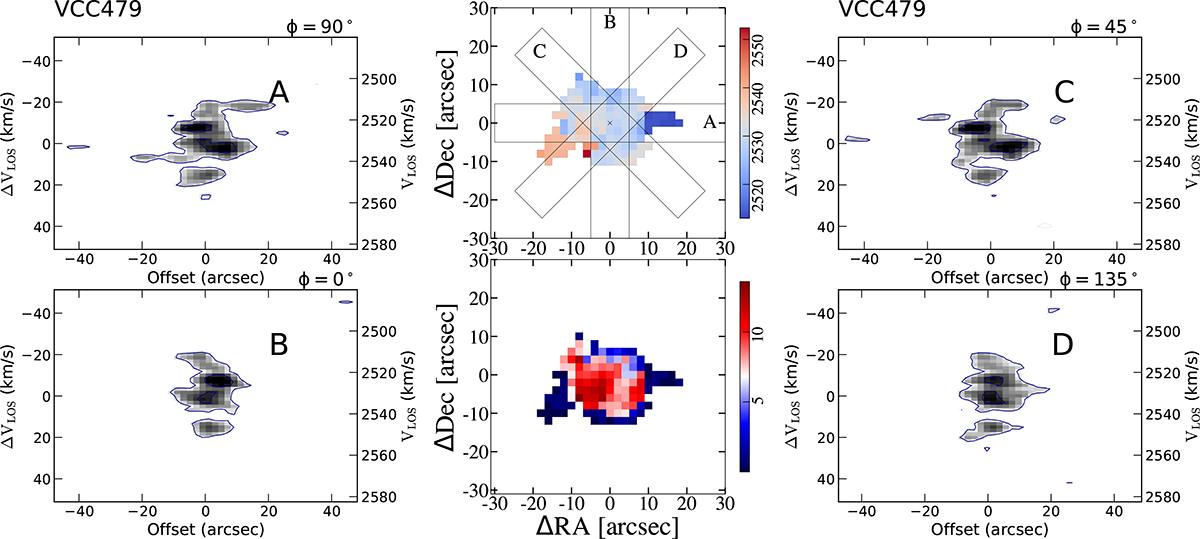
PV diagram of four directions. Upper left panel: PV diagram along the major axis with PA = 90°. Bottom left panel: PV diagram along the minor axis. Upper middle panel: Moment-1 map and directions used to extract PV diagram. The width of the rectangles correspond to the width of the slit used to extract the PV maps. Bottom middle panel: Velocity dispersion map. The color bars are in units of kilometers per second.
Current usage metrics show cumulative count of Article Views (full-text article views including HTML views, PDF and ePub downloads, according to the available data) and Abstracts Views on Vision4Press platform.
Data correspond to usage on the plateform after 2015. The current usage metrics is available 48-96 hours after online publication and is updated daily on week days.
Initial download of the metrics may take a while.