Open Access
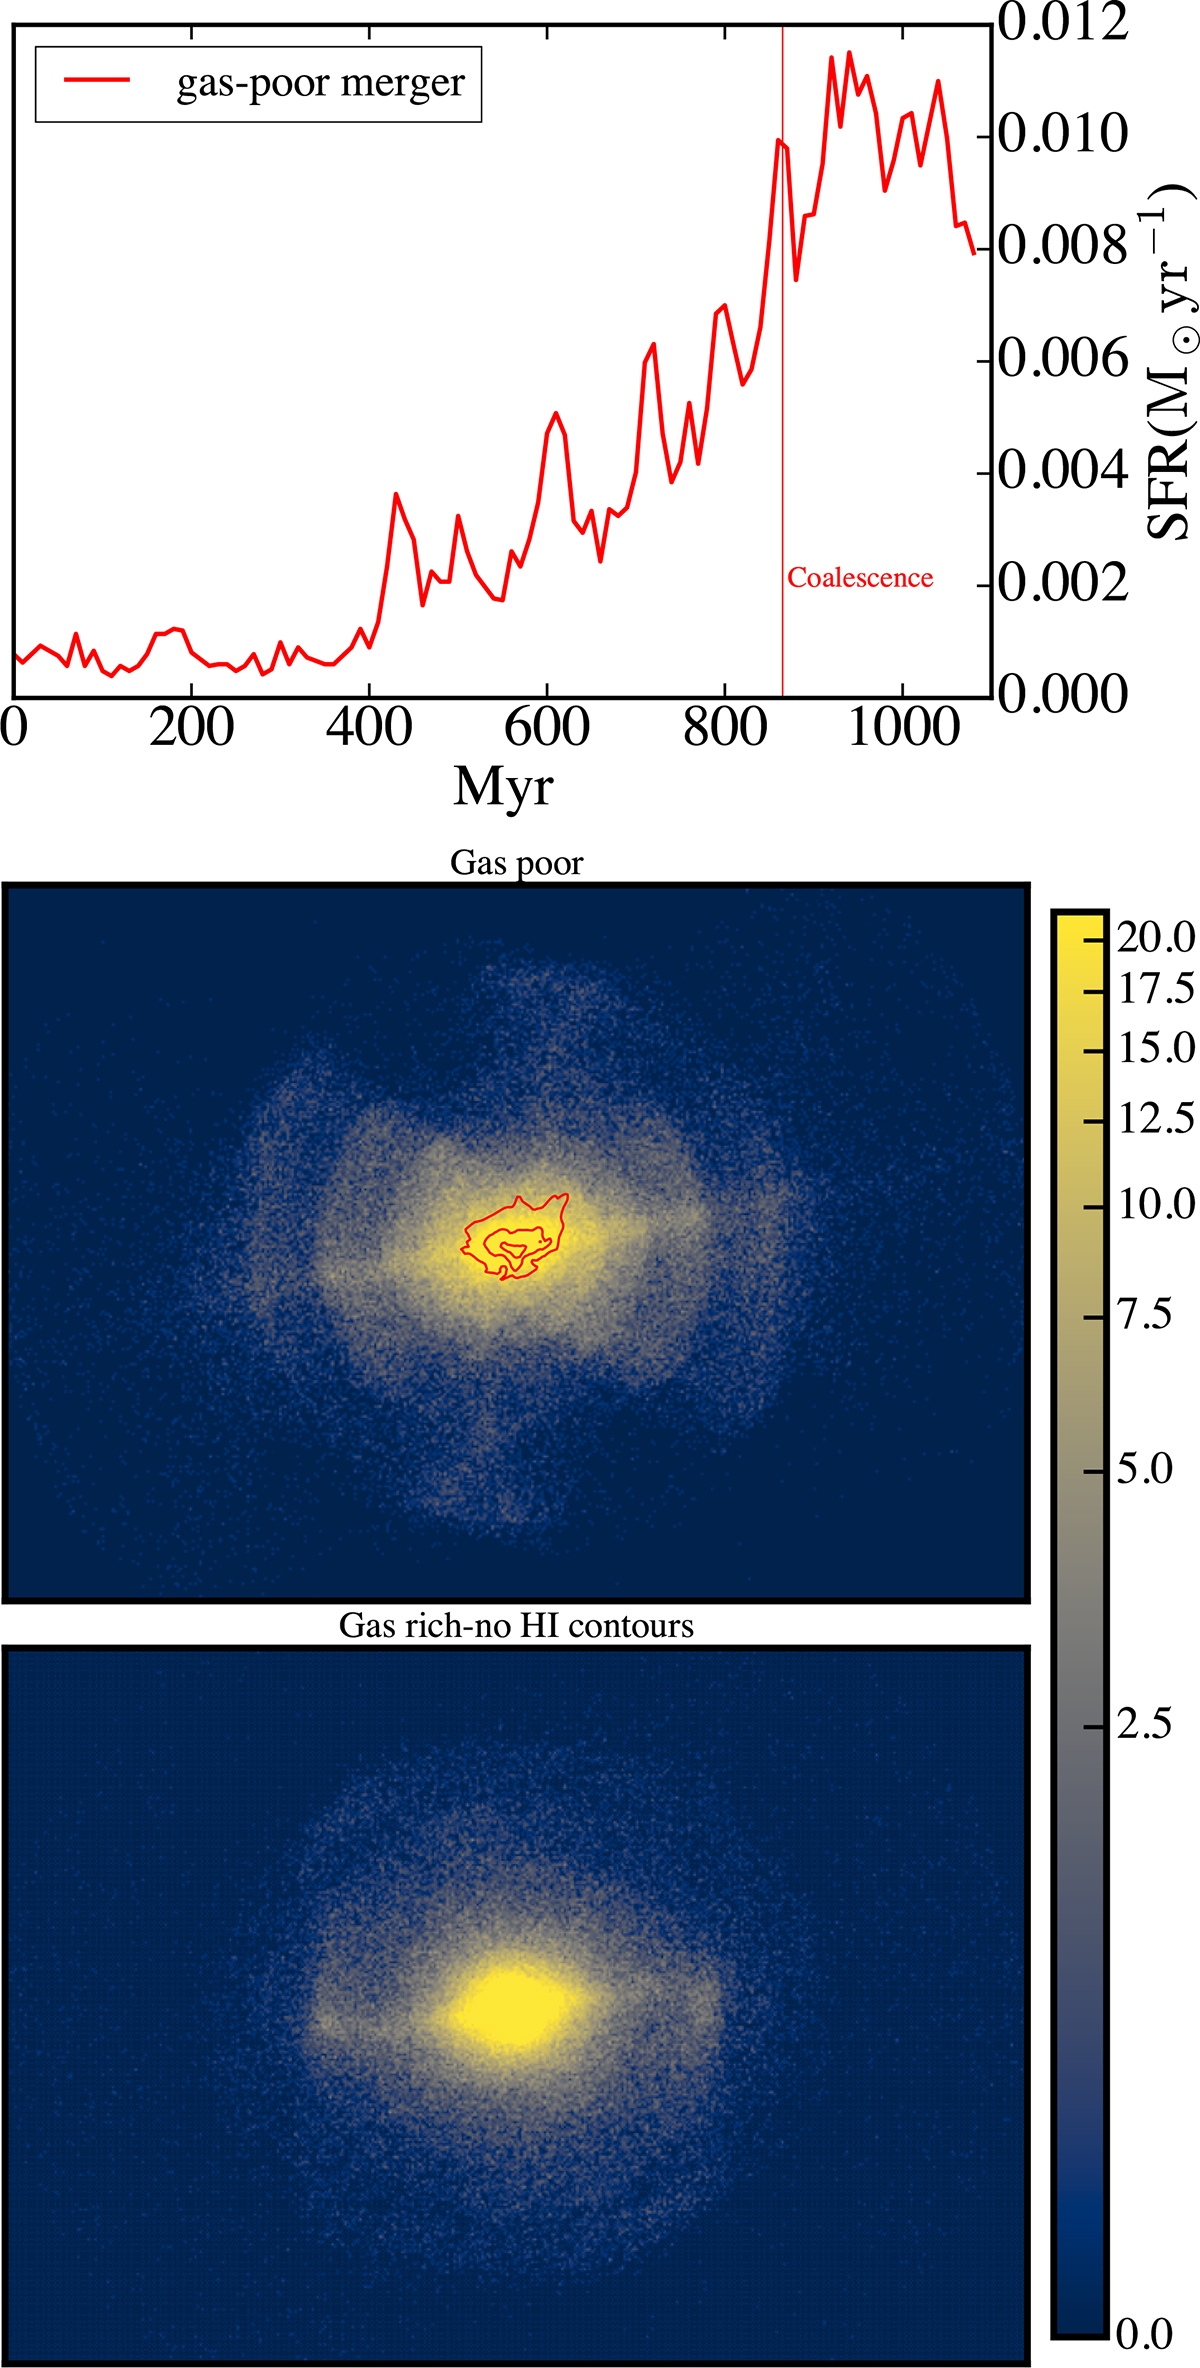
Fig. 14.
Download original image
Upper panel: SFR evolution of gas-poor major merger analogous to VCC 479. Middle panel: Stellar particle map overlaid with HI gas contours at 0.5, 5, and 50 M⊙ pc−2 for the gas-poor merger. The stellar map is expressed in units of solar masses per square parsec. Bottom panel: Stellar map of the gas-rich merger.
Current usage metrics show cumulative count of Article Views (full-text article views including HTML views, PDF and ePub downloads, according to the available data) and Abstracts Views on Vision4Press platform.
Data correspond to usage on the plateform after 2015. The current usage metrics is available 48-96 hours after online publication and is updated daily on week days.
Initial download of the metrics may take a while.