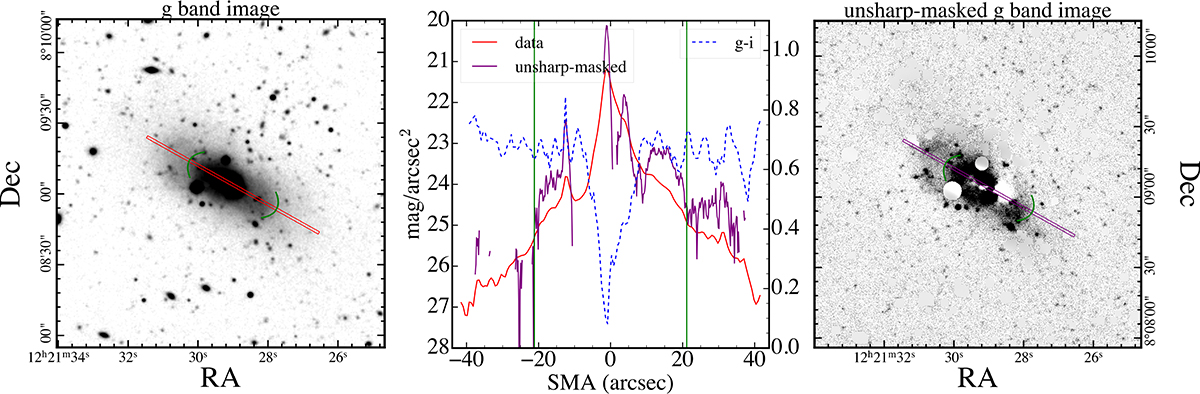
Fig. 2.
Download original image
Left panel: NGVS g-band image in grayscale. The green ellipse arcs mark the shells. Middle panel: Slit profile of original g-band image (solid red curve) and unsharp-masked image (solid purple curve). The g−i color slit-profile measured from the smoothed g and i images by ADAPTSMOOTH (Zibetti et al. 2009) is plotted with a dashed blue line. The green vertical lines mark the radii of the stellar shells. Right panel: Unsharp-masked g-band image. The red (left panel) and purple (right panel) rectangular regions indicate the area used to extract the slit profiles shown in middle panel.
Current usage metrics show cumulative count of Article Views (full-text article views including HTML views, PDF and ePub downloads, according to the available data) and Abstracts Views on Vision4Press platform.
Data correspond to usage on the plateform after 2015. The current usage metrics is available 48-96 hours after online publication and is updated daily on week days.
Initial download of the metrics may take a while.