Fig. 5.
Download original image
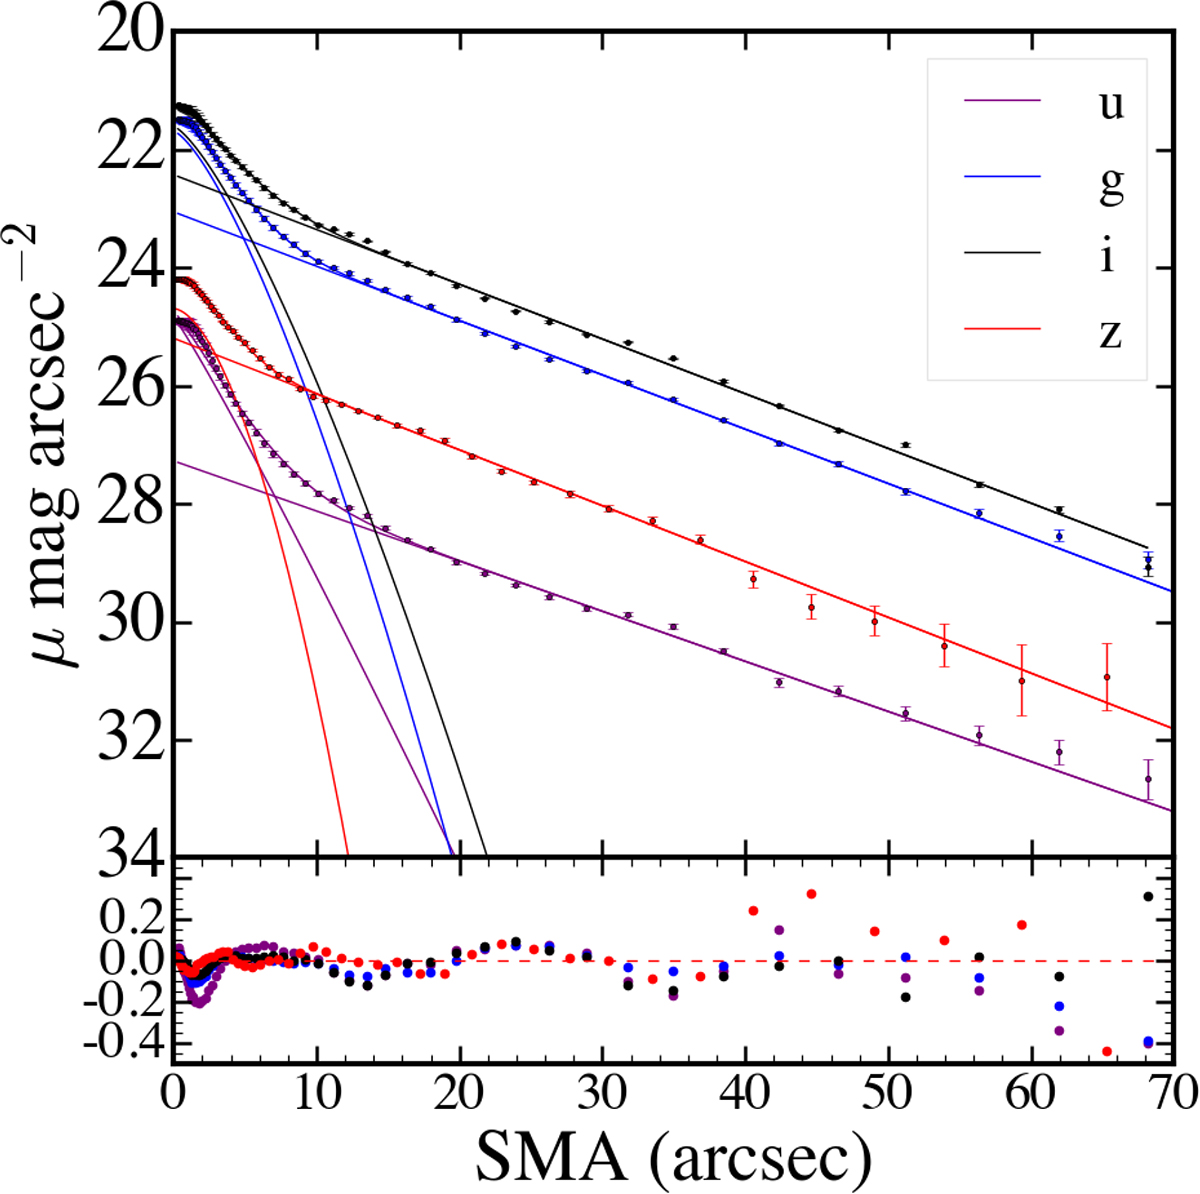
Surface brightness profiles of VCC 479 in the NGVS u, g, i, and z bands. The dots with error bars denote the average surface brightness profile from the ellipse fitting. Solid curves show the best-fit decomposition of the surface brightness profiles into an outer exponential component and a central light excess modeled with a Sersic profile. For clarity, the surface brightness profiles in the u and z bands are arbitrarily shifted downward by 3 mag arcsec−2. The residuals, obtained by subtracting the best-fit profiles, are shown in the bottom panel.
Current usage metrics show cumulative count of Article Views (full-text article views including HTML views, PDF and ePub downloads, according to the available data) and Abstracts Views on Vision4Press platform.
Data correspond to usage on the plateform after 2015. The current usage metrics is available 48-96 hours after online publication and is updated daily on week days.
Initial download of the metrics may take a while.