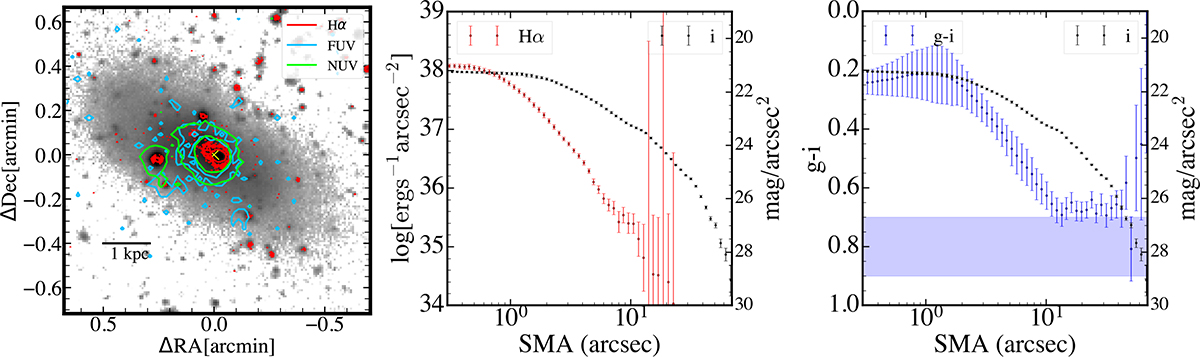
Fig. 8.
Download original image
Left panel: Star formation distribution shown by Hα (red contour), UV (blue contour for FUV and lime contour for NUV) overplotted in gray-scale NGVS g band image. The contour values are 3 times and 10 times the noise level. The yellow cross marks the galaxy center. Middle panel: Radial profile of Hα surface density from the narrow band Hα images. We also present the i-band surface brightness profile as a reference. Right panel: Color profile of VCC 479 by calculating the difference between g band and i band surface brightness profile (Figure 5 in Sect. 3.3). The blue-shaded areas represent the 2σ range of the g − i colors of normal dEs at the same magnitudes as VCC 479, derived from the color–magnitude relation of the Virgo cluster core region by NGVS observations (Roediger et al. 2017).
Current usage metrics show cumulative count of Article Views (full-text article views including HTML views, PDF and ePub downloads, according to the available data) and Abstracts Views on Vision4Press platform.
Data correspond to usage on the plateform after 2015. The current usage metrics is available 48-96 hours after online publication and is updated daily on week days.
Initial download of the metrics may take a while.