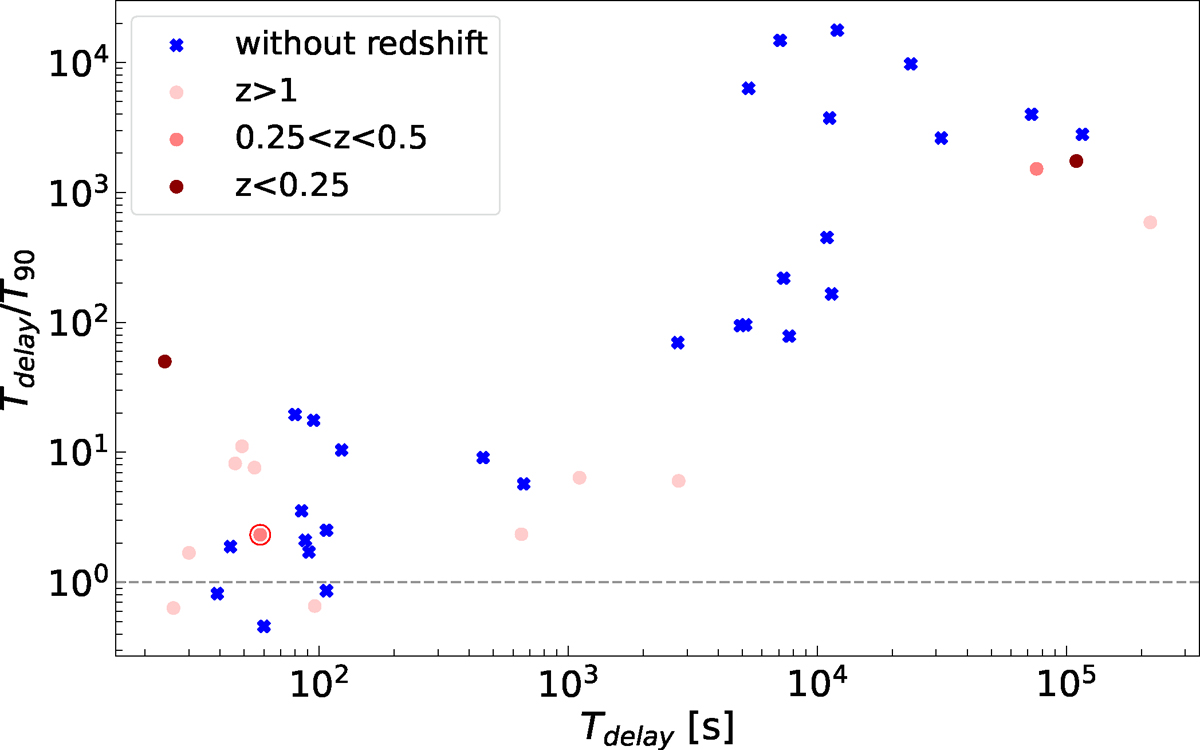
Fig. 1.
Download original image
Ratio of the observation delay Tdelay and T90 vs. Tdelay for the GRBs listed in Table A.1. GRBs with and without redshift are denoted by red and blue markers, respectively. The dashed horizontal line denotes when the ratio is equal to one, meaning that for GRBs with a ratio lower than one, observations started on a timescale comparable to the duration of the prompt emission. For the sample under consideration, the GRBs fulfilling these conditions are GRB131030A, GRB141026A, GRB150428B, GRB170728B, and GRB180720C. The only GRB from this sample that was significantly detected at TeV energies, namely GRB 190114C, is marked with an empty circle.
Current usage metrics show cumulative count of Article Views (full-text article views including HTML views, PDF and ePub downloads, according to the available data) and Abstracts Views on Vision4Press platform.
Data correspond to usage on the plateform after 2015. The current usage metrics is available 48-96 hours after online publication and is updated daily on week days.
Initial download of the metrics may take a while.