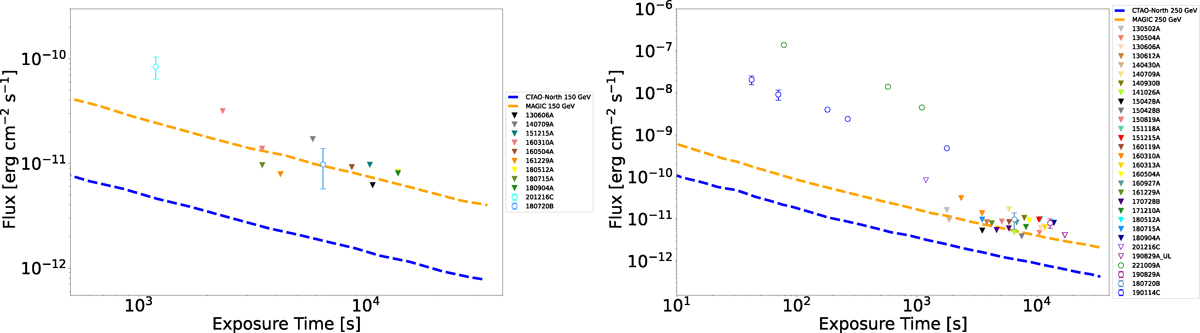
Fig. 3.
Download original image
Observed flux points or ULs for TeV-detected GRBs (empty markers) and most stringent ULs for catalog of GRBs non-detected by MAGIC (filled markers) vs. exposure time. The 2σ sensitivity level curves of the MAGIC and CTAO-North array are also displayed. Two reference energy values are shown: 150 GeV (left plot) and 250 GeV (right plot).
Current usage metrics show cumulative count of Article Views (full-text article views including HTML views, PDF and ePub downloads, according to the available data) and Abstracts Views on Vision4Press platform.
Data correspond to usage on the plateform after 2015. The current usage metrics is available 48-96 hours after online publication and is updated daily on week days.
Initial download of the metrics may take a while.