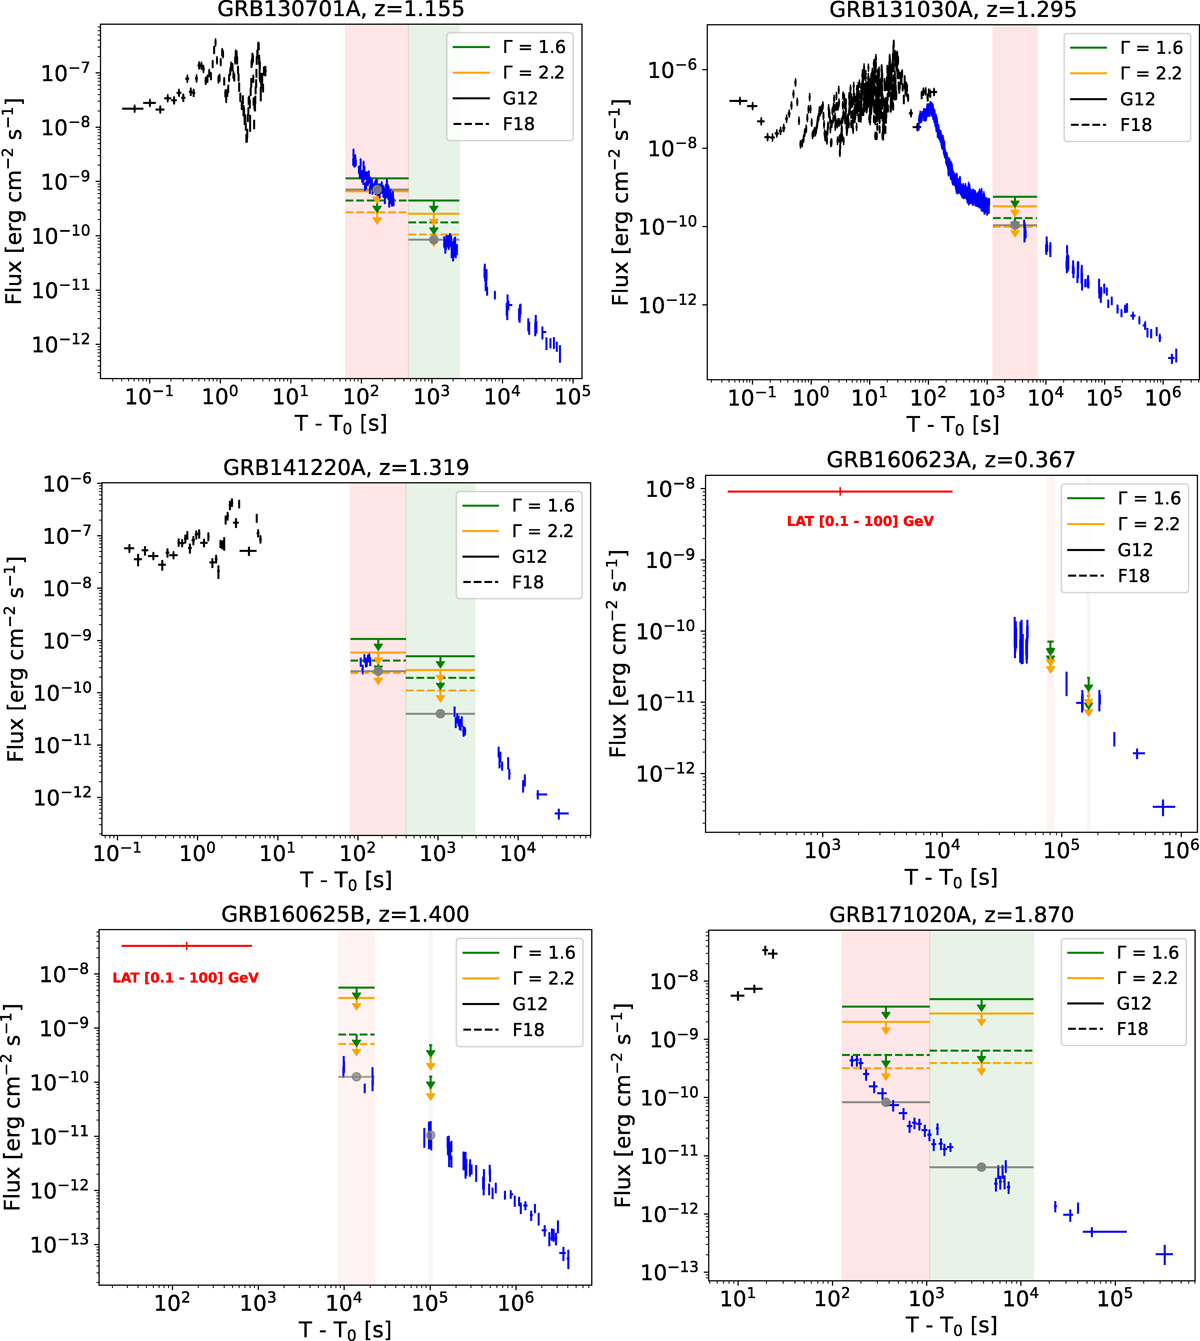
Fig. 4.
Download original image
Multi-wavelength light curves of the subsample of six GRBs described in Sect. 4.2.2 and Table 1. We show the flux light curves with X-ray data (black for BAT and blue for XRT), average X-ray flux in the MAGIC observational time windows (grey points), LAT data (red, if present), and MAGIC ULs assuming two different photon indices and EBL models for the subsample selected for the comparison with lower-energy bands. The time windows in which MAGIC ULs were computed are marked with vertical red and green stripes.
Current usage metrics show cumulative count of Article Views (full-text article views including HTML views, PDF and ePub downloads, according to the available data) and Abstracts Views on Vision4Press platform.
Data correspond to usage on the plateform after 2015. The current usage metrics is available 48-96 hours after online publication and is updated daily on week days.
Initial download of the metrics may take a while.