Open Access
Fig. 2
Download original image
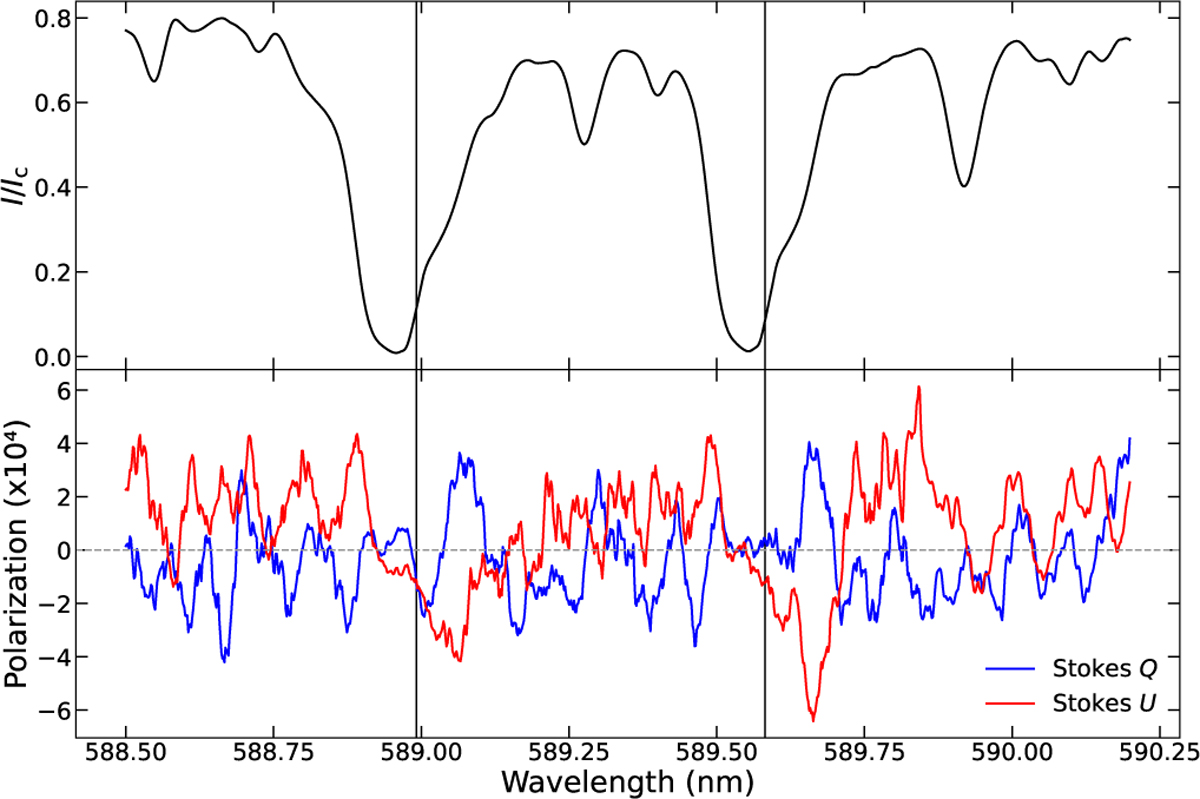
Polarized spectrum of Antares around Na I Dl and D2 lines. The upper panel depicts the intensity profile. The lower panel shows the linear polarization signal, with Stokes Q in blue and Stokes U in red. The vertical lines are the center of the lines Dl and D2, corrected from the Doppler velocity of –4.3 km s–1.
Current usage metrics show cumulative count of Article Views (full-text article views including HTML views, PDF and ePub downloads, according to the available data) and Abstracts Views on Vision4Press platform.
Data correspond to usage on the plateform after 2015. The current usage metrics is available 48-96 hours after online publication and is updated daily on week days.
Initial download of the metrics may take a while.