Fig. 4
Download original image
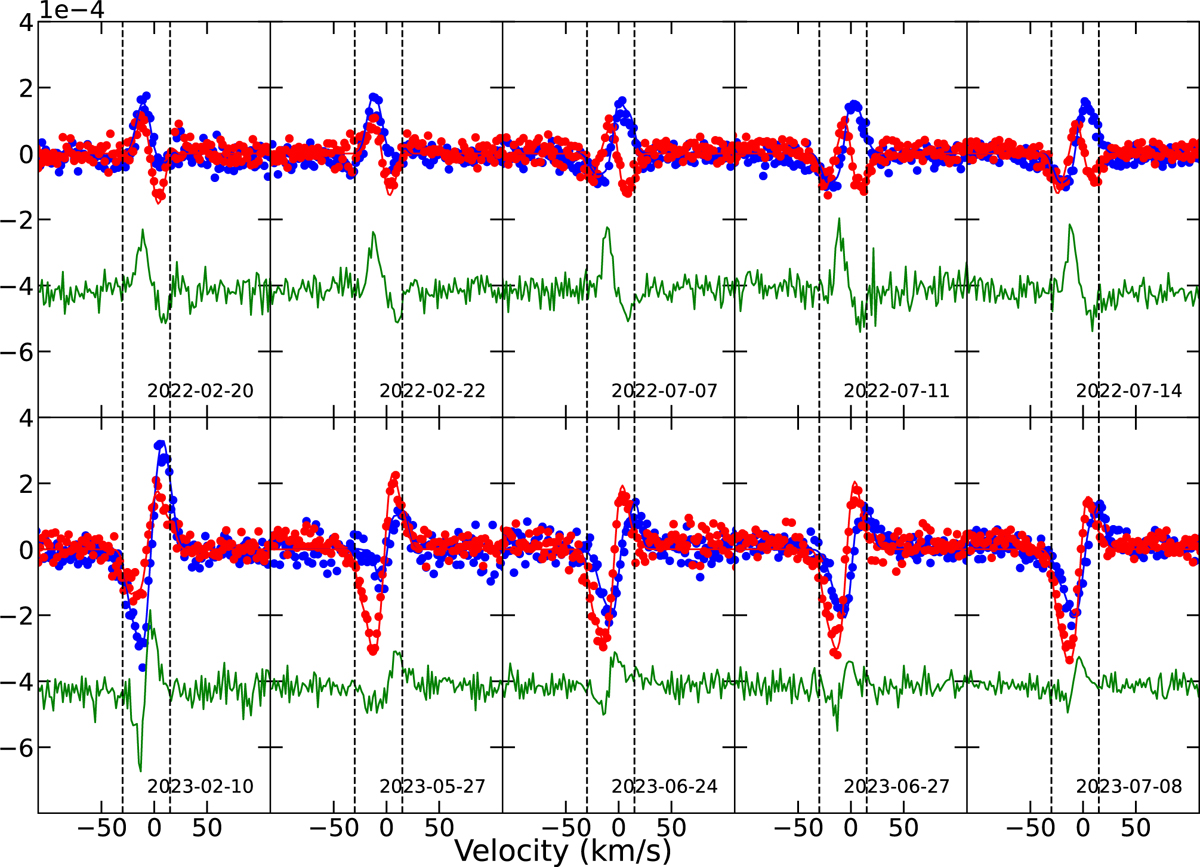
LSD proflies of Stokes Q in blue and U in red. The red and blue lines represent the brightness distribution that better fits the observed profile. The observation dates are given in the bottom right of the figure. Stokes V is represented in green and has been shifted down and had its amplitude multiplied by 5 so that the profiles can be seen better. The vertical dashed lines represent, from left to right, the velocity, υ0, and the velocity of the star, υ*, adopted in our model.
Current usage metrics show cumulative count of Article Views (full-text article views including HTML views, PDF and ePub downloads, according to the available data) and Abstracts Views on Vision4Press platform.
Data correspond to usage on the plateform after 2015. The current usage metrics is available 48-96 hours after online publication and is updated daily on week days.
Initial download of the metrics may take a while.