Open Access
Fig. A.1
Download original image
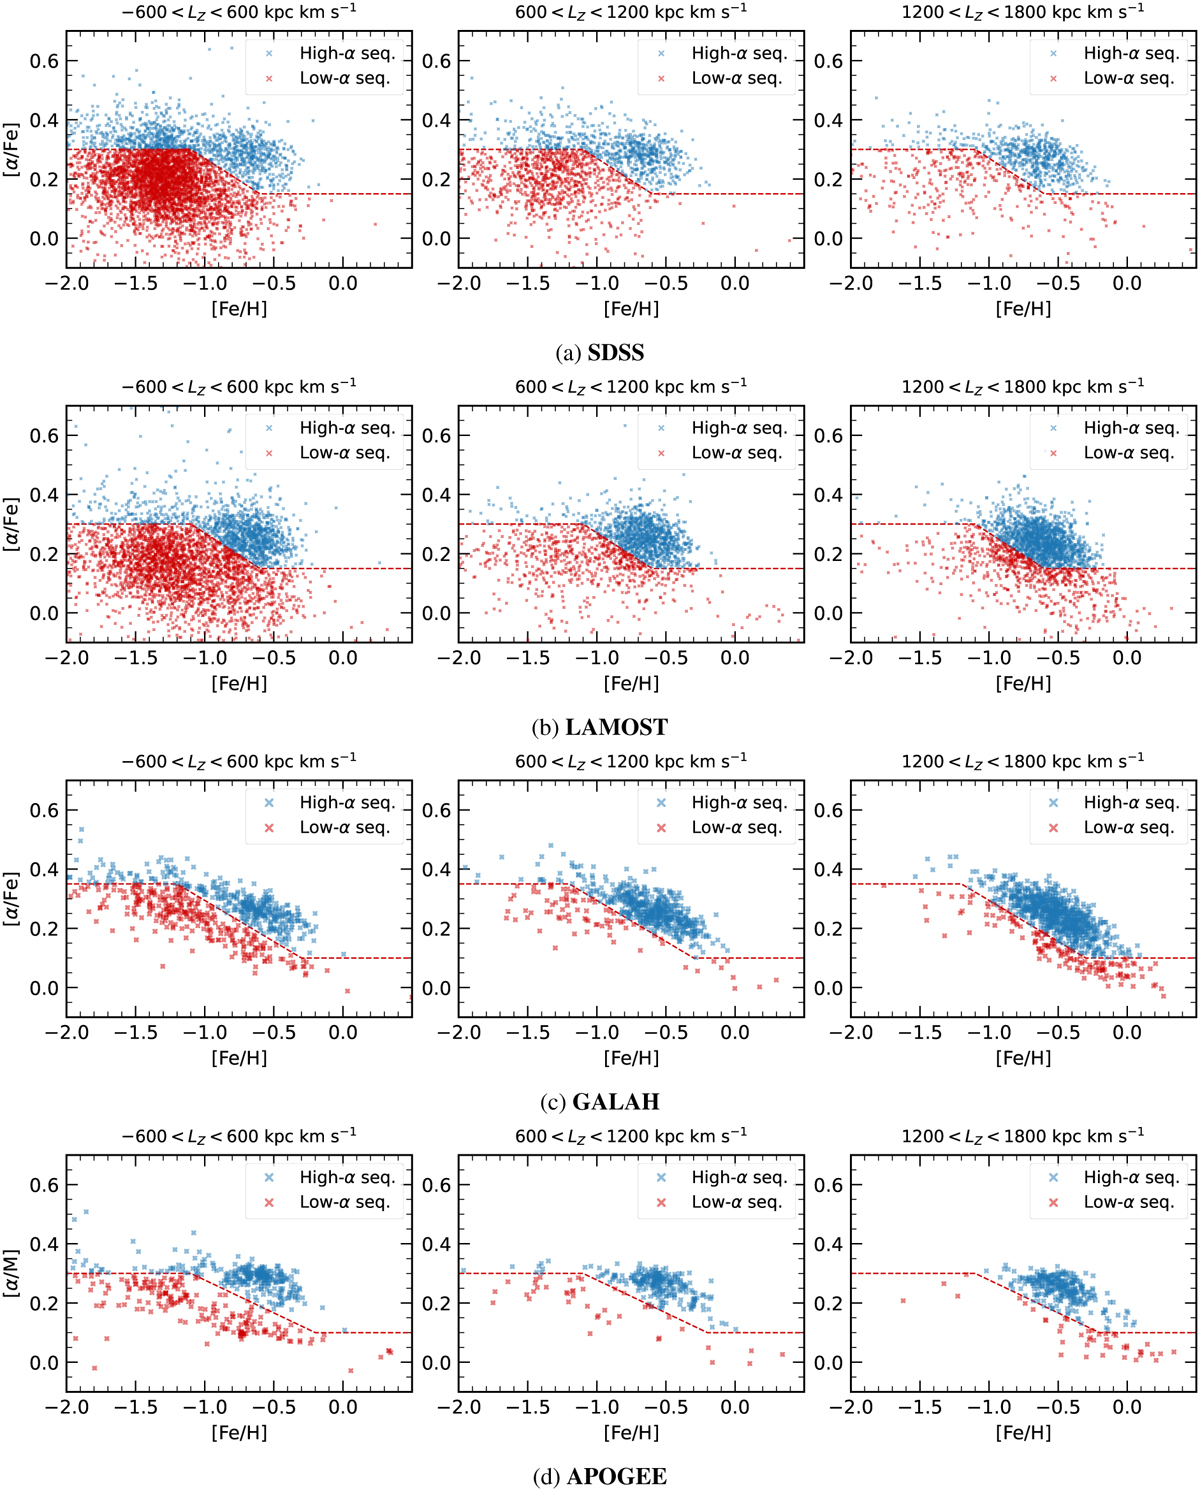
Distribution of [α/Fe] versus [Fe/H] for the spectroscopic samples used in this study. The dashed red lines, derived from these datasets by examining systematic variations across three LZ bins, were used to separate the high-α and low-α sequences within each sample.
Current usage metrics show cumulative count of Article Views (full-text article views including HTML views, PDF and ePub downloads, according to the available data) and Abstracts Views on Vision4Press platform.
Data correspond to usage on the plateform after 2015. The current usage metrics is available 48-96 hours after online publication and is updated daily on week days.
Initial download of the metrics may take a while.