Fig. C.1
Download original image
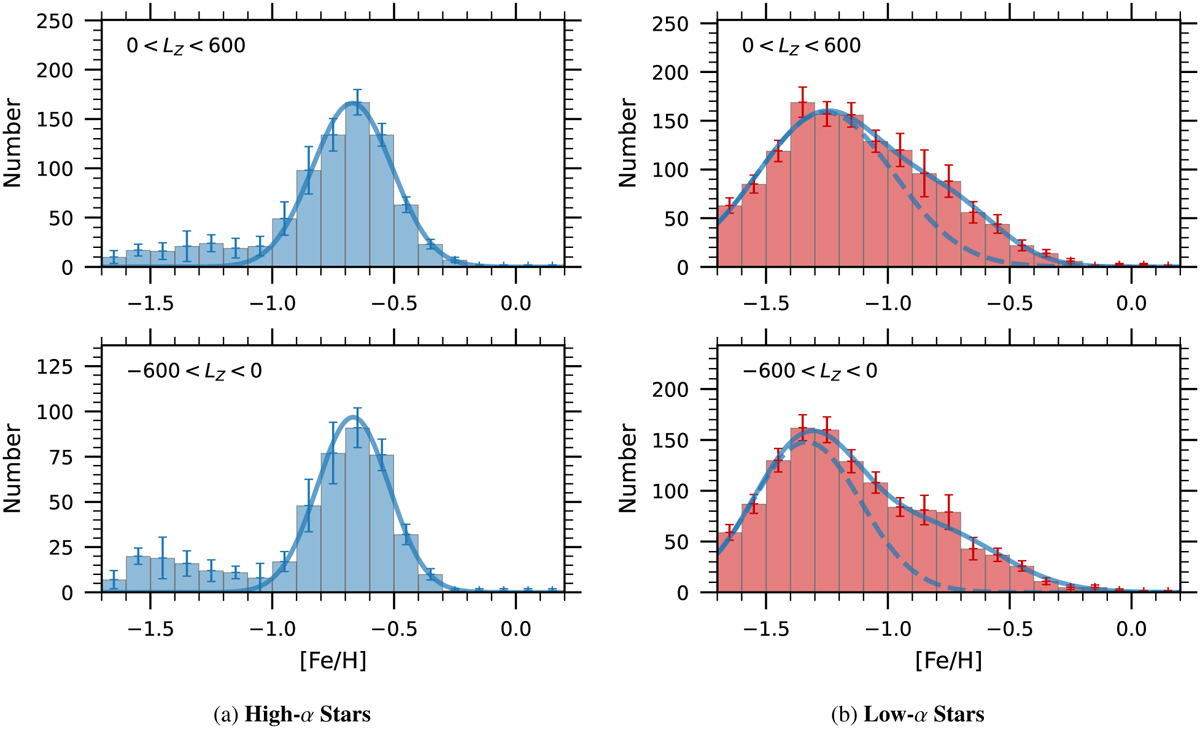
Decomposition of the metallicity distribution of the LAMOST sample, subdivided into 0 < LZ < 600 kpc km s−1 (top) and −600 < LZ < 0 kpc km s−1 (bottom), respectively. The left panels show the case of high-α stars, and the right panels for low-α stars. The solid lines represent the best-fitting results from the same decomposition procedure as in the main samples (see Figs. 8 and 9).
Current usage metrics show cumulative count of Article Views (full-text article views including HTML views, PDF and ePub downloads, according to the available data) and Abstracts Views on Vision4Press platform.
Data correspond to usage on the plateform after 2015. The current usage metrics is available 48-96 hours after online publication and is updated daily on week days.
Initial download of the metrics may take a while.